
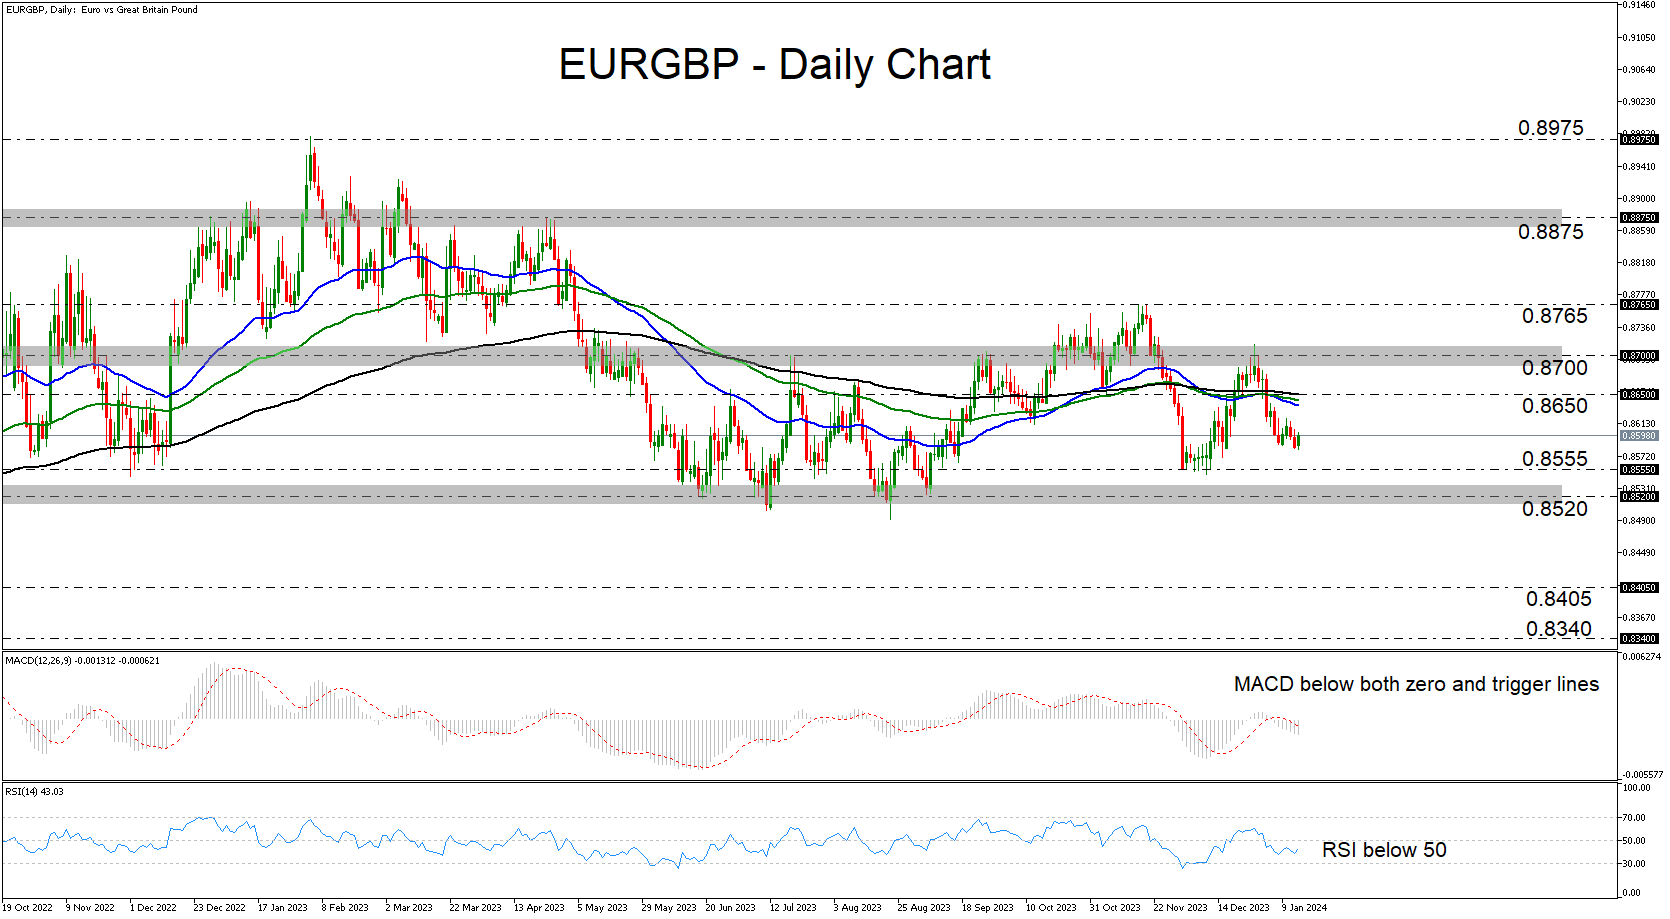
- EURGBP slides but remains within a range
- MACD and RSI detect negative momentum
- A dip below 0.8520 could turn the outlook bearish
EURGBP has been drifting south recently, after it hit resistance slightly above the 0.8700 territory. That said, although the pair is currently trading below all three of the plotted exponential moving averages (EMAs) on the daily chart, it is still stuck within the sideways range between 0.8520 and 0.8700. That range has been containing most of the price action since May.
Our short-term oscillators detect negative momentum. The MACD runs below both its zero and trigger lines, while the RSI, although it ticked up somewhat, remains below its equilibrium 50 line. These indicators suggest that some further declines may be on the cards, perhaps until the lower end of the range at around 0.8520.
For the outlook to turn bearish, a decisive dip below that hurdle may be needed. Such a move may encourage the bears to dive all the way down to the low of August 24, 2022, the break of which could carry extensions towards the low of August 4 of that year.
The picture may start brightening only upon a recovery above the upper end of the range at around 0.8700. This could allow advances towards the peak of November 20, where another breach could carry larger bullish implications, perhaps paving the way towards the 0.8875 zone, defined as resistance by the peak of April 25.
To sum up, EURGBP lost some ground recently, but remained within a broader trendless path. The move signaling that the bears have stolen all the bulls’ swords may be a dip below the 0.8520 barrier.


%20on%20the%20daily%20chart,%20it%20is%20still%20stuck%20within%20the%20sideways%20range%20between%200.8520%20and%200.8700.%20That%20range%20has%20been%20containing%20most%20of%20the%20price%20action%20since%20May.)