
- Will gold extend its negative wave below 2,013?
- Holds beneath SMAs and Ichimoku cloud
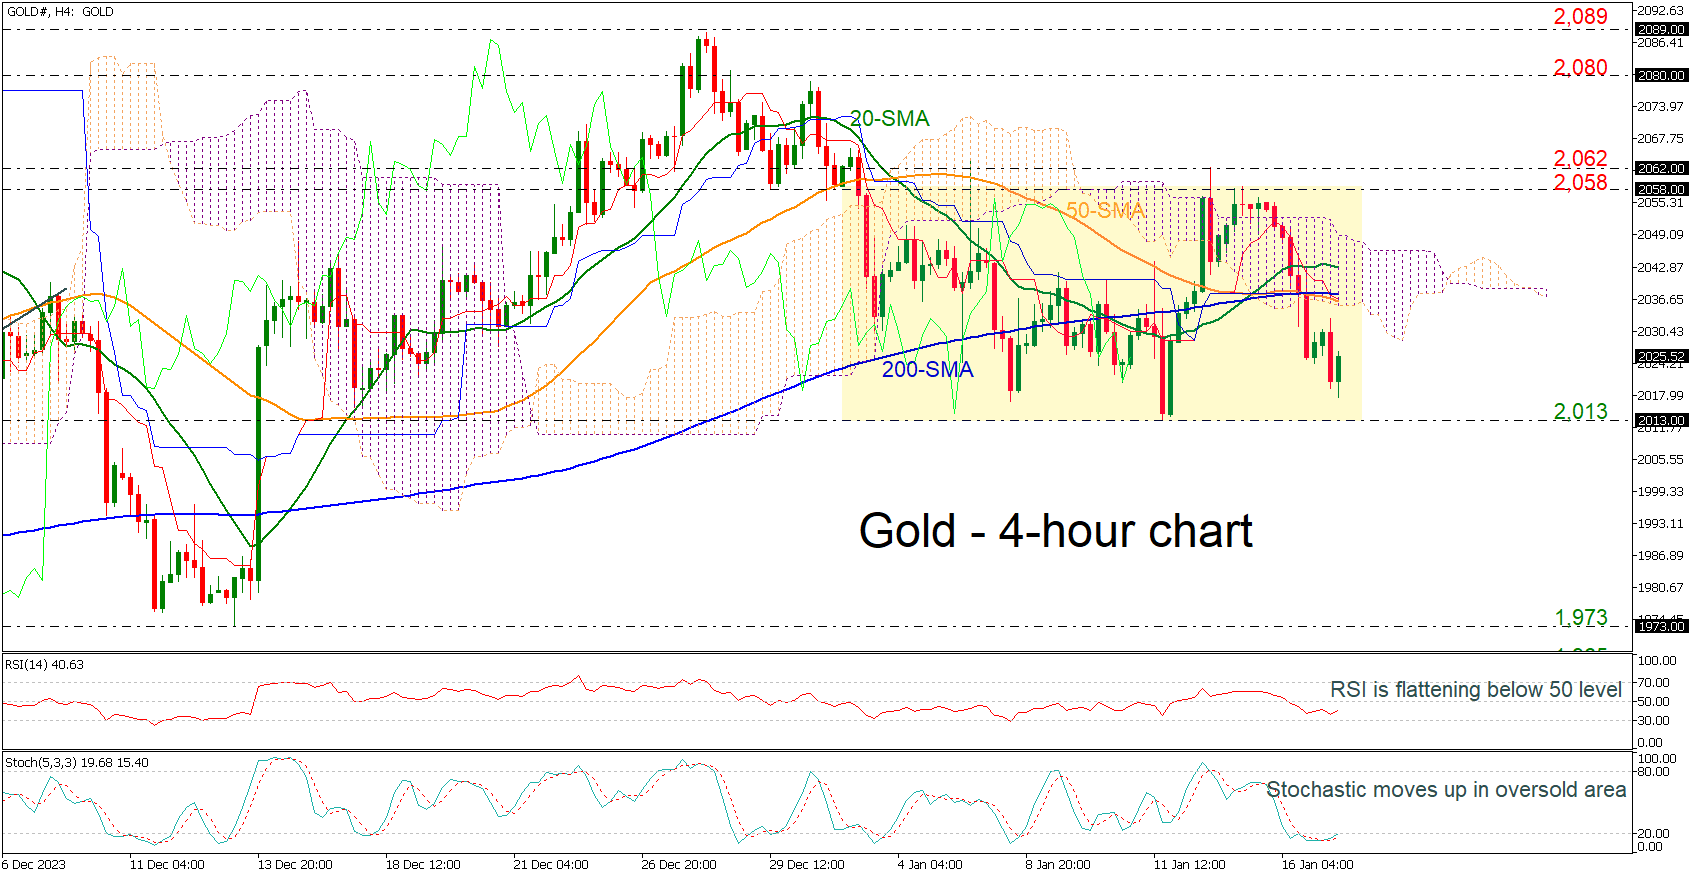
- Technical oscillators suggest bullish correction
Gold prices have been posting a negative wave over the last two days in the 4-hour chart, holding beneath the Ichimoku cloud and the short-term moving average lines. The 2,013 level is significant for traders as it failed several times in the past to have a closing session beneath it. So, any movements lower could endorse the bearish bias.
Technically, the RSI indicator suggests an upside retracement as it is ticking marginally up in the negative territory, while the stochastic oscillator posted a bullish crossover within its %K and %D lines in the oversold region, indicating a bullish correction too.
A dive below the 2,013 crucial line could open the way for steeper selling interest towards the 1,973 barrier and the 1,965 mark, registered in mid-November.
Otherwise, a move higher could find resistance levels near the 50- and the 200-period simple moving averages (SMAs) around 2,037 ahead of the 20-period SMA at 2,042, which stands within the Ichimoku cloud. Even higher, the 2,058-2,062 zone may halt upside pressure again, endorsing the two-week trading range of 2,013-2,062.
To sum up, the precious metal is moving sideways in the near-term timeframe and a clearer direction could come if there is a break above 2,062 or below 2,013.


