
- Gold is lower again today
- Holds beneath short-term SMAs
- Momentum indicators disappoint below mid-levels
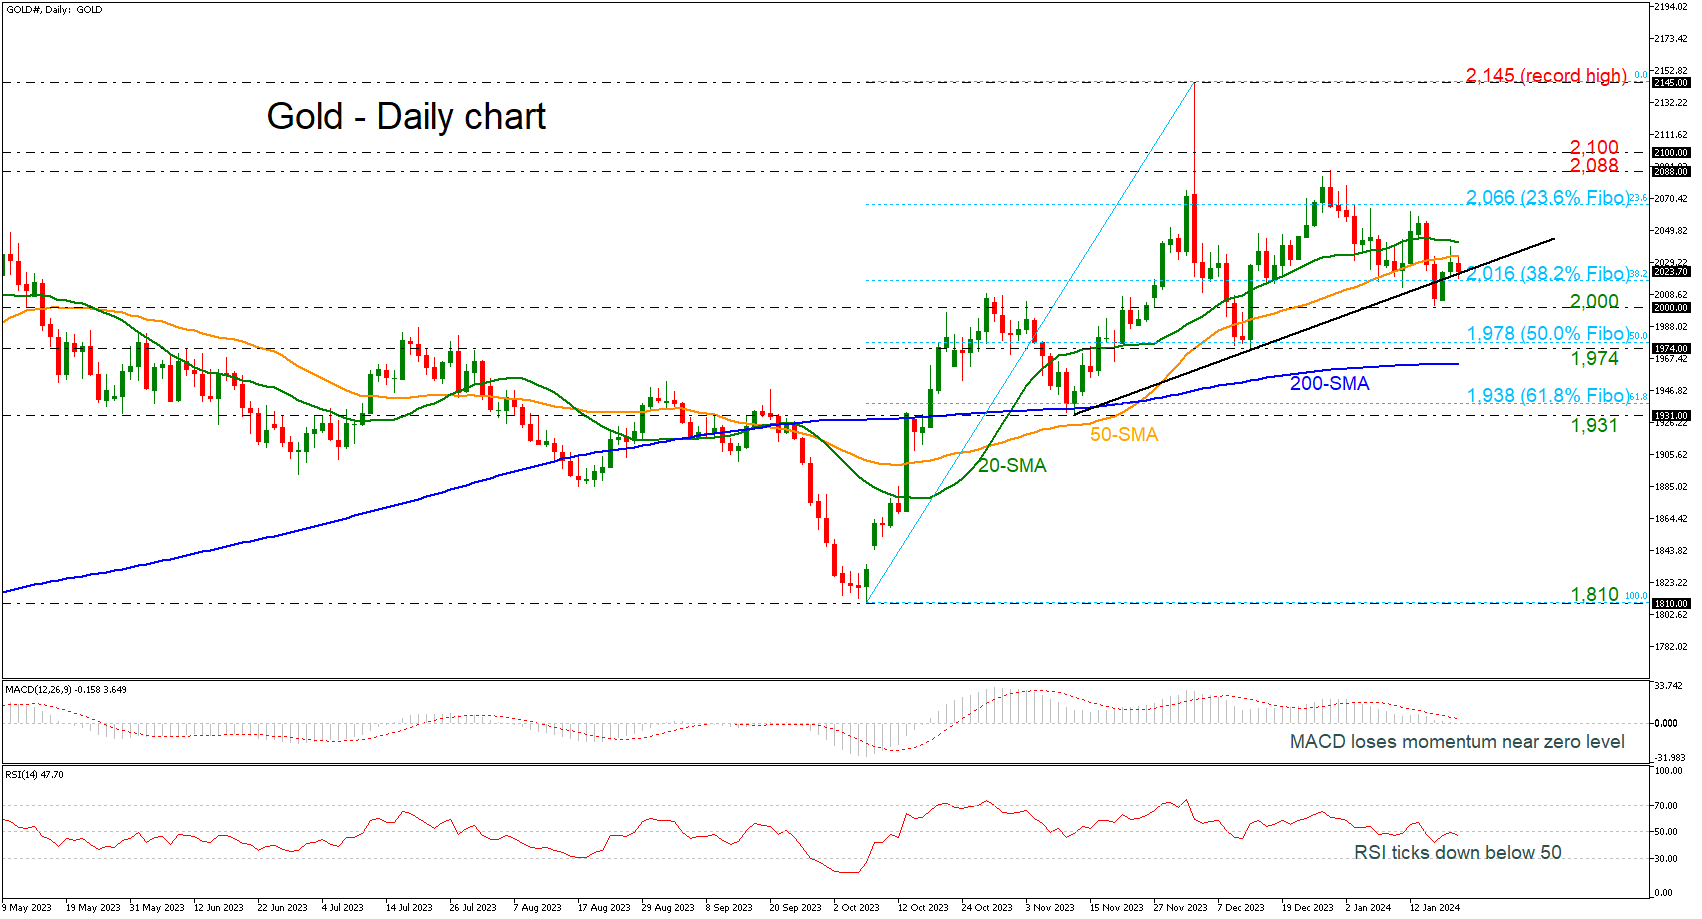
Gold prices are fighting with the short-term uptrend line, which has been drawn since mid-November, and the 38.2% Fibonacci retracement level of the upward wave from 1,810 to 2,145 at 2,016.
Also, the market is failing to surpass above the 20- and the 50-day simple moving averages (SMAs), indicating weak momentum. The MACD oscillator is moving lower beneath its trigger line and near the zero level, while the RSI is pointing south after the pullback off the 50 zone.
Should the bulls thirst for more upside moves, they would try to overcome the short-term SMAs and then test the resistance set by the 23.6% Fibonacci of 2,066. If successful, they could then plan their course for the 2,088-2,100 restrictive region ahead of the record high of 2,145.
On the other hand, the bears are probably keen on retaking market control and defending November’s trendline. They could then face the significant 2,000 region before resting near the busy area of the 50.0% Fibonacci of 1,978, the 1,974 support and the 200-day SMA at 1,964.
To sum up, gold bulls are trying to cancel out the current bearish move that has been in place since the 2,088 high, but the path higher remains tricky, especially due to the weak support from the momentum indicators.


