
- US 500 index still confirms a strong upside tendency
- MACD and RSI in positive territories
- Next resistance at 161.8% Fibonacci extension
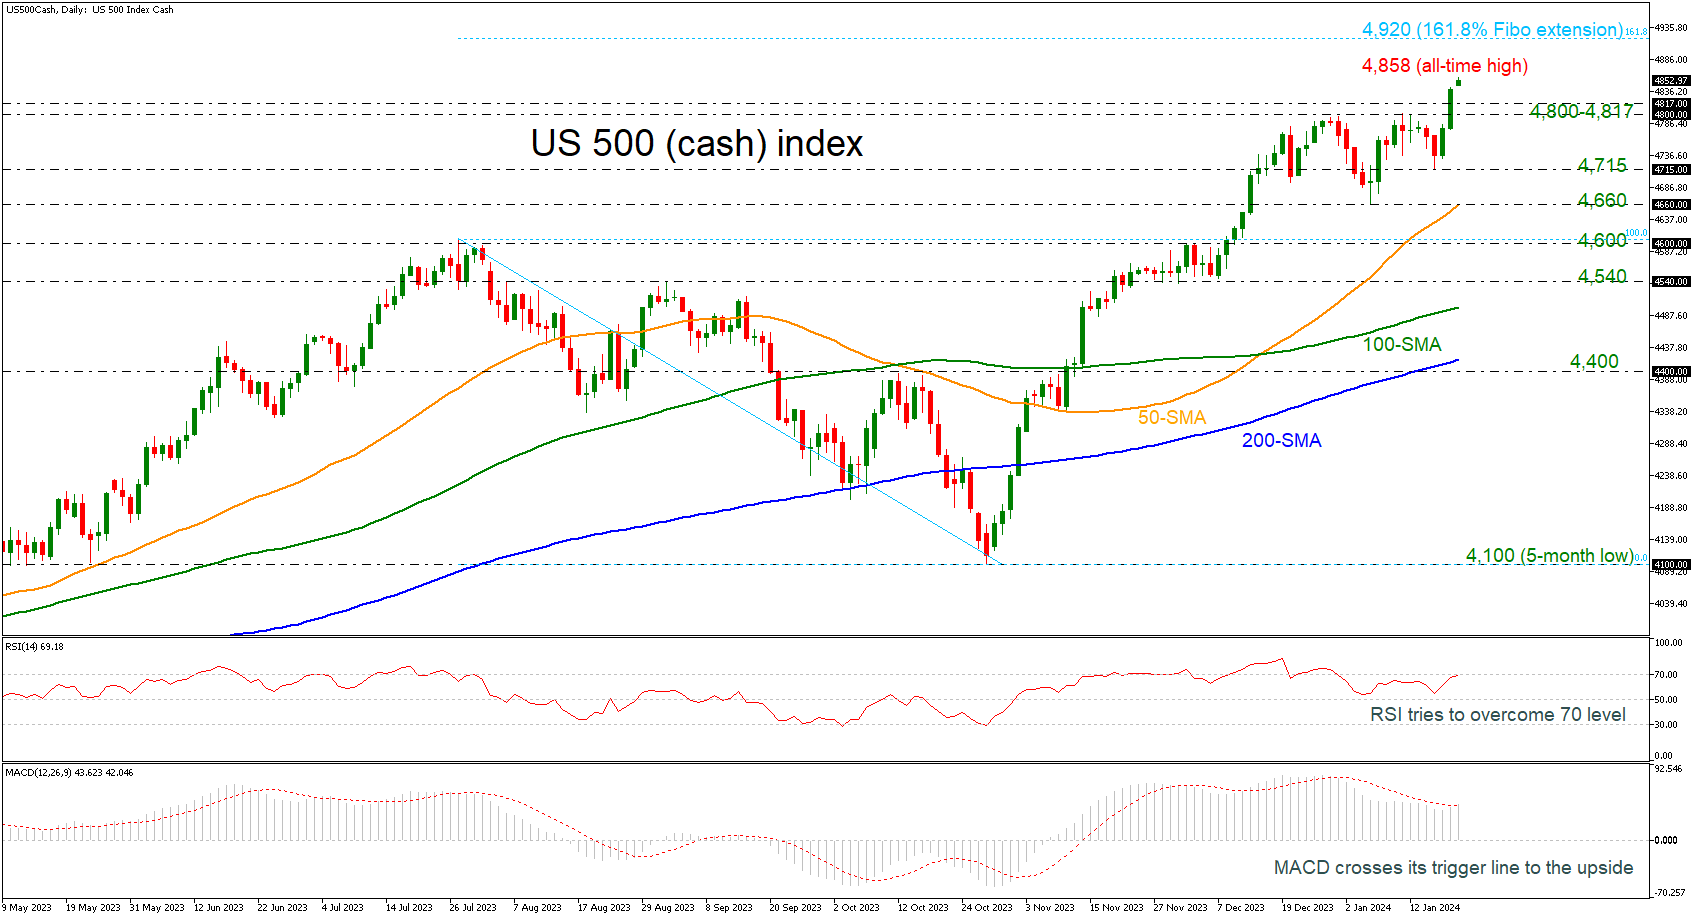
The US 500 cash index has been in a prolonged uptrend since the end of October, posting a fresh all-time high of 4,858 earlier today. After a period of rangebound trading, the pair stormed above the 4,800-4,817 region, which is now acting as support area.
According to technical indicators, the RSI is moving towards the 70 level and the MACD oscillator is creating a bullish crossover with its trigger line above the zero area. Both are confirming the aggressive buying interest in price.
Considering that the short-term oscillators remain tilted to the upside, the price could edge higher and visit uncharted levels such as the 161.8% Fibonacci extension level of the down leg from 4,600 to 4,100 at 4,920. Piercing through that wall, the index may hit the next psychological number such as 5,000.
On the flipside, should the price reverse lower, immediate support could be found at the aforementioned zone of 4,800-4,817. A break below that area could trigger a retreat towards the 4,715 support and the 50-day simple moving average (SMA), which overlaps with the 4,660 barricade. In case of a downside violation, the bears may then attack the 4,600 low.
In brief, the US 500 index is still developing near the record highs and only a decline beneath the 50-day SMA may suggest a bearish correction in the medium-term timeframe.


 Favors Upside")