
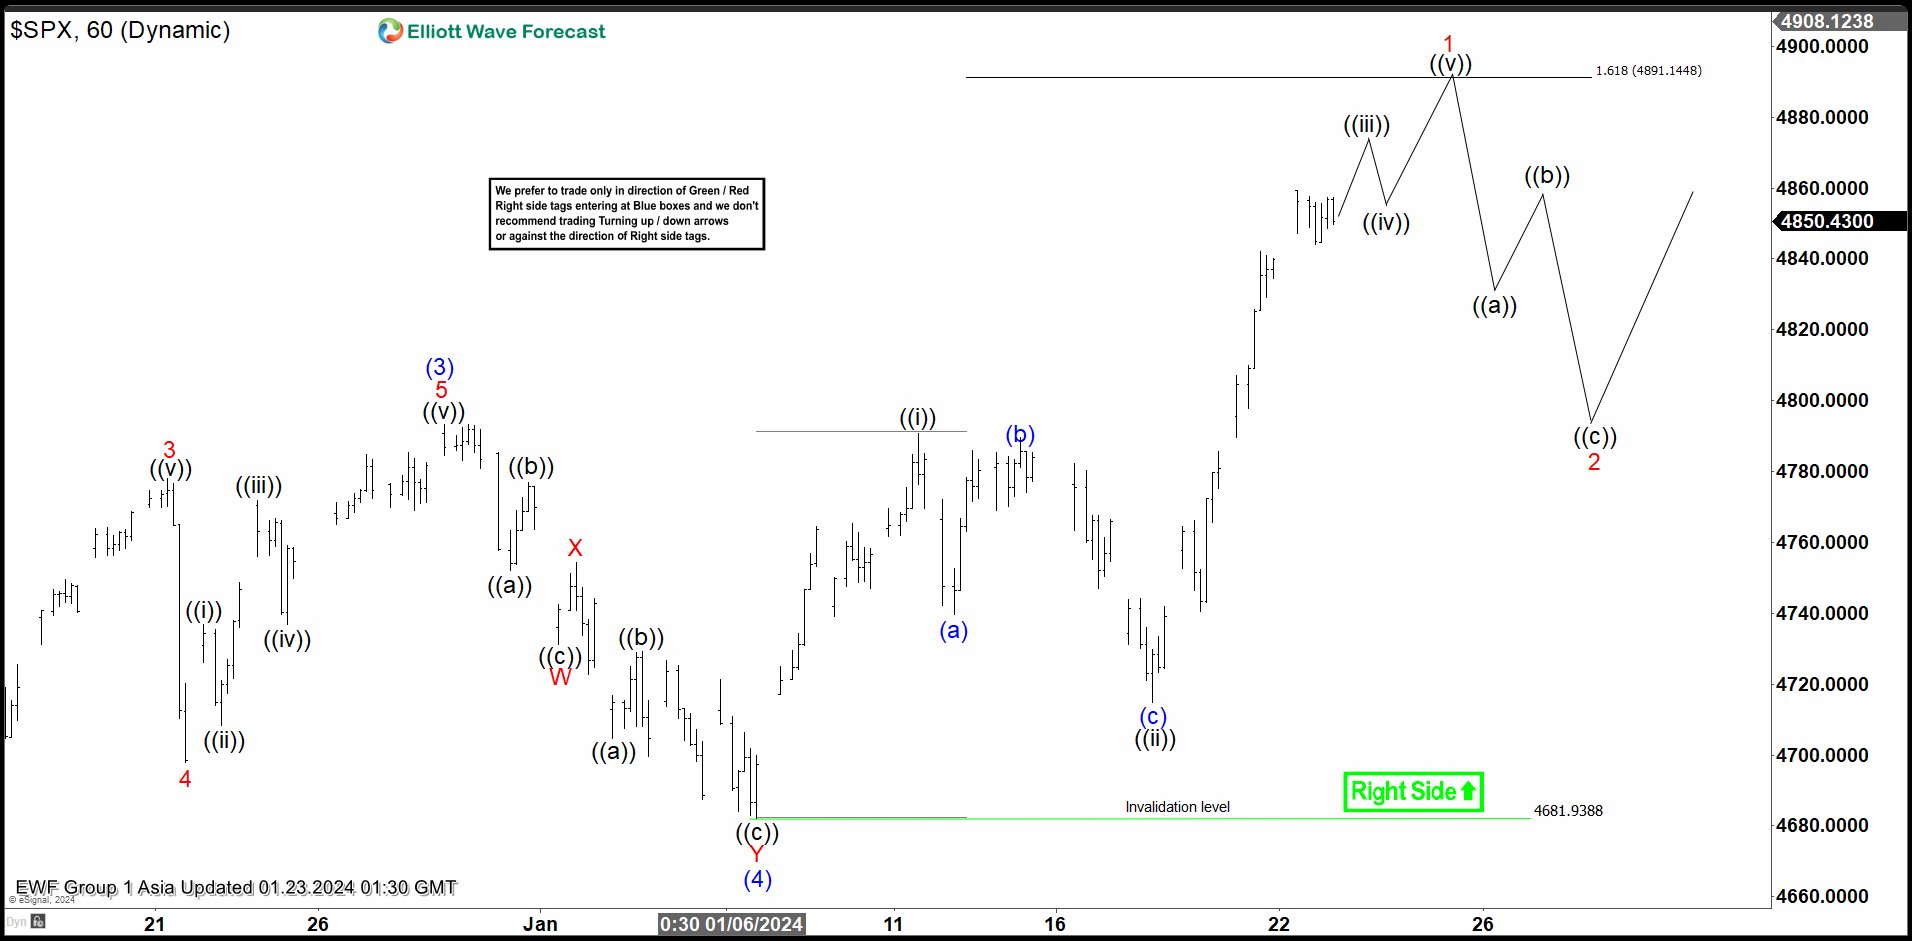
Short term Elliott Wave View in S&P 500 (SPX) suggests that rally to 4793.3 ended wave (3). Pullback in wave (4) is unfolding as a double three Elliott Wave structure. Down from wave (3), wave ((a)) ended at 4752 and wave ((b)) rally ended at 4776.9. Wave (c)) lower ended at 4731.17 which completed wave W in higher degree. Wave X rally ended at 4754.33. Index then resumed lower in wave Y. Down from wave X, wave ((a)) ended at 4704.72, wave ((b)) ended at 4729.29 and wave ((c)) lower ended at 4681.94. This completed wave Y of (4).
The Index then turned higher in wave (5). Internal subdivision of wave (5) is unfolding as an impulse in lesser degree. Up from wave (4), wave ((i)) ended at 4790.80 and wave ((ii)) pullback subdivided into a zigzag structure. Wave (a) ended at 4739.58, wave (b) ended at 4789.52, and wave (c) lower ended at 4714.82 which completed wave ((ii)). Expect wave ((iii)) to end soon, then it should pullback in wave ((iv)) before turning higher again in wave ((v)) to complete wave 1 in higher degree. Afterwards, Index should pullback in wave 2 to correct cycle from 1.6.2024 low in 3, 7, or 11 swing before the rally resumes. Near term, as far as pivot at 4681.94 low stays intact, expect dips to find support in 3, 7, 11 swing for further upside.
S&P 500 (SPX) 60 Minutes Elliott Wave Chart
SPX Elliott Wave Video


By loading the video, you agree to YouTube’s privacy policy.
Learn more


 Favors Upside")
%20suggests%20that%20rally%20to%204793.3%20ended%20wave%20(3).%20Pullback%20in%20wave%20(4)%20is%20unfolding%20as%20a%20double%20three%20Elliott%20Wave%20structure.%20Down%20from%20wave%20(3),%20wave%20((a))%20ended%20at%204752%20and%20wave%20((b))%20rally%20ended%20at%204776.9.%20Wave%20(c))%20lower%20ended%20at%204731.17%20which%20completed%20wave%20W%20in%20higher%20degree.%20Wave%20X%20rally%20ended%20at%204754.33.%20Index%20then%20resumed%20lower%20in%20wave%20Y.%20Down%20from%20wave%20X,%20wave%20((a))%20ended%20at%204704.72,%20wave%20((b))%20ended%20at%204729.29%20and%20wave%20((c))%20lower%20ended%20at%204681.94.%20This%20completed%20wave%20Y%20of%20(4).)