
- US 30 index finds support at 161.8% Fibonacci
- Technical indicators suggest bearish retracement
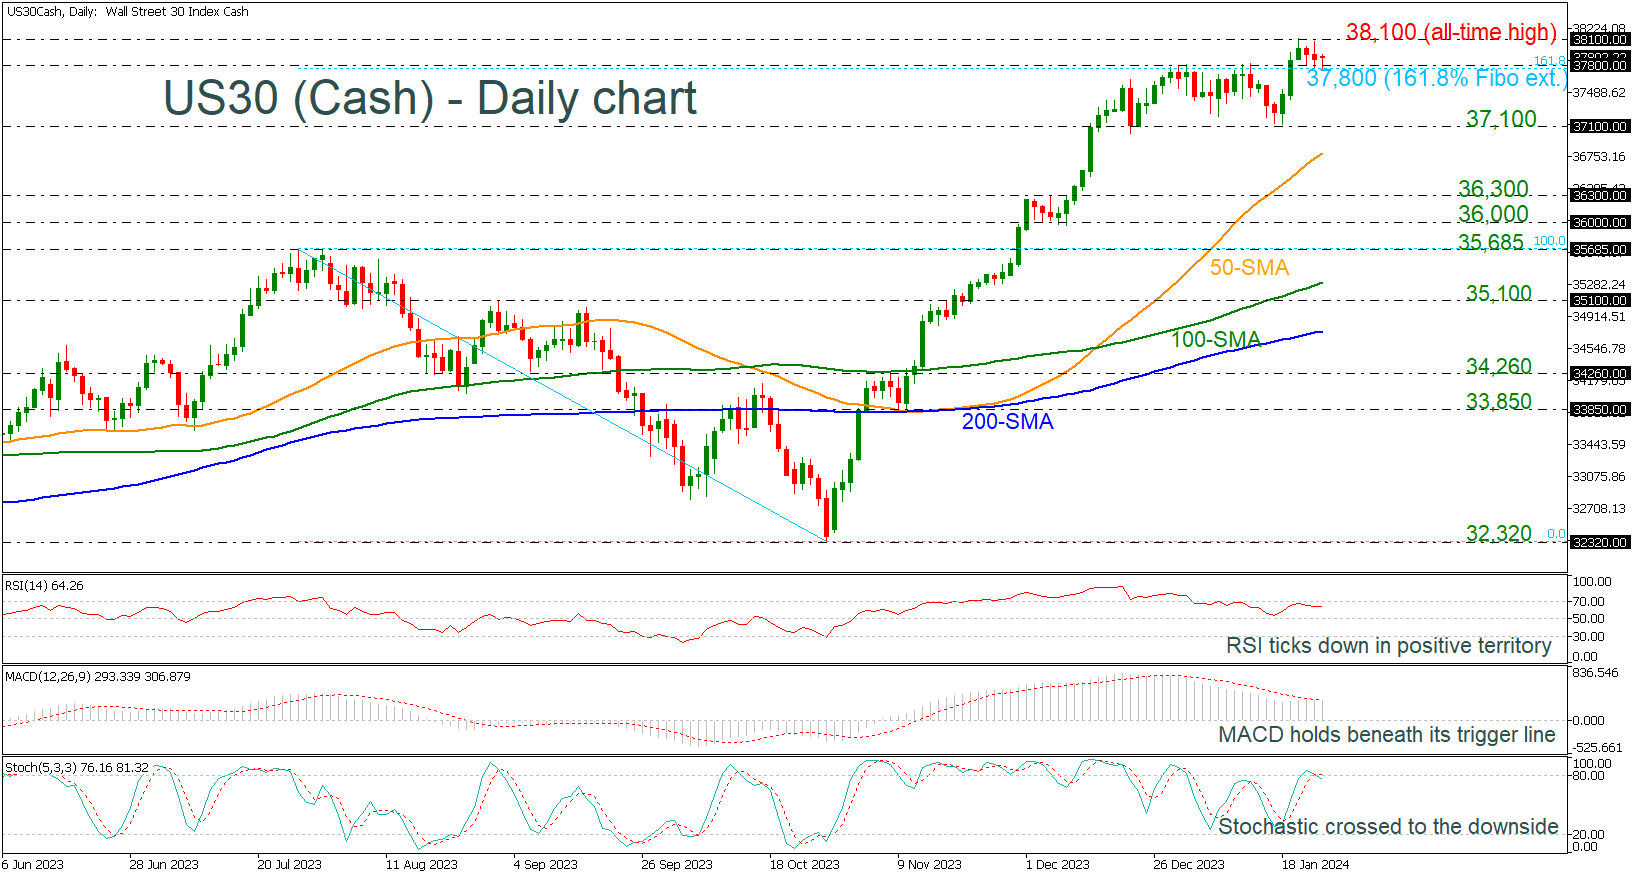
The US 30 index is easing from the all-time high of 38,108 and is meeting again the 161.8% Fibonacci extension level of the down leg from 35,685 to 32,320 at 37,800, which had acted as strong resistance over the last month.
Technically, the oscillators are indicating a negative correction. The RSI is retreating from the 70 level, while the MACD fell beneath its trigger line in the positive region. Moreover, the stochastic oscillator posted a bearish crossover within its %K and %D lines in the overbought area.
The market structure is negative in the very short-term picture as the price is currently moving lower. If the bears take the upper hand and the index, meets the 37,100 support. Selling forces could intensify towards the 50-day simple moving average (SMA) at 36,800. Then, additional losses from there could retest the 36,000 round number.
In the event the price stays resilient above the 161.8% Fibonacci extension of 37,800, the bulls might push for a close above the record high of 38,100. Therefore, a successful move higher could immediately shift the attention to the next round number of 39,000.
In a nutshell, the US 30 index may remain supported in the coming sessions, though room for improvement could be limited before the next bearish round takes place.


