
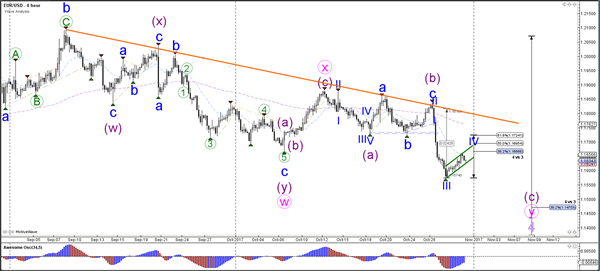
Currency pair EUR/USD
The EUR/USD has retraced to the 38.2% Fibonacci level of wave 4 (blue) which could be a resistance zone. A break below the bear flag (green) could indicate the continuation of the wave 5 (blue) within a larger wave C (purple).

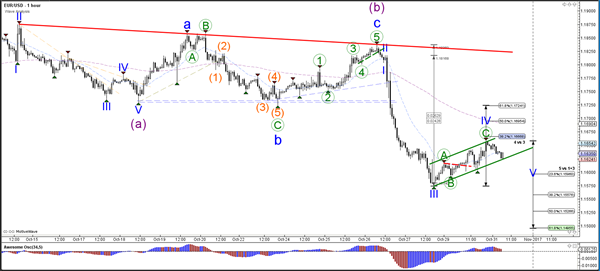
The EUR/USD is showing strong bearish momentum and has most likely completed a wave 3 (blue). An ABC (green) seems to have been completed within the wave 4 (blue) if price breaks below the channel (green).
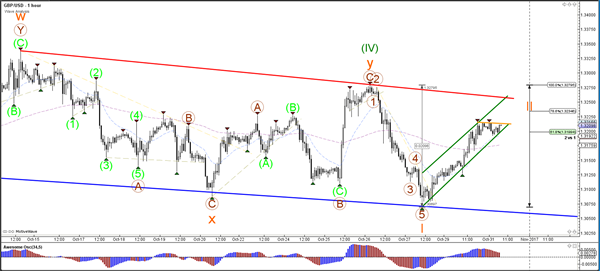
Currency pair GBP/USD
The GBP/USD break below the support line (blue) would confirm a bearish continuation. For the moment price remains choppy but a wave 5 could occur if price does not break above resistance (red).

The GBP/USD is showing strong bullish momentum but the wave structure could change when a clear higher low is visible or when price breaks above resistance (red).
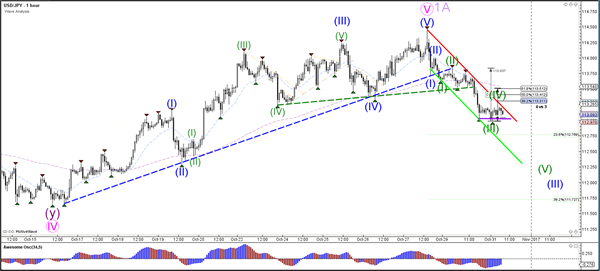
Currency pair USD/JPY
The USD/JPY has broken below the support trend lines (dotted) after reaching the main target zone at 114.50-115. This bearish break could start a wave 2 or B (light purple).
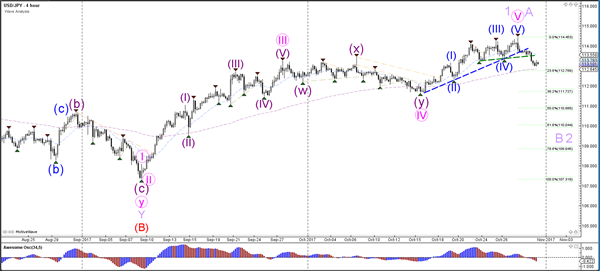
The USD/JPY has retraced to the 38.2% Fibonacci level of wave 4 (green) and is building a bearish channel lower.


 Elliott Wave : Forecasting the Rally from the Equal Legs Zone")


