
- AUDCAD continues to trim gains, reaches key support level
- Technical picture reflects oversold conditions
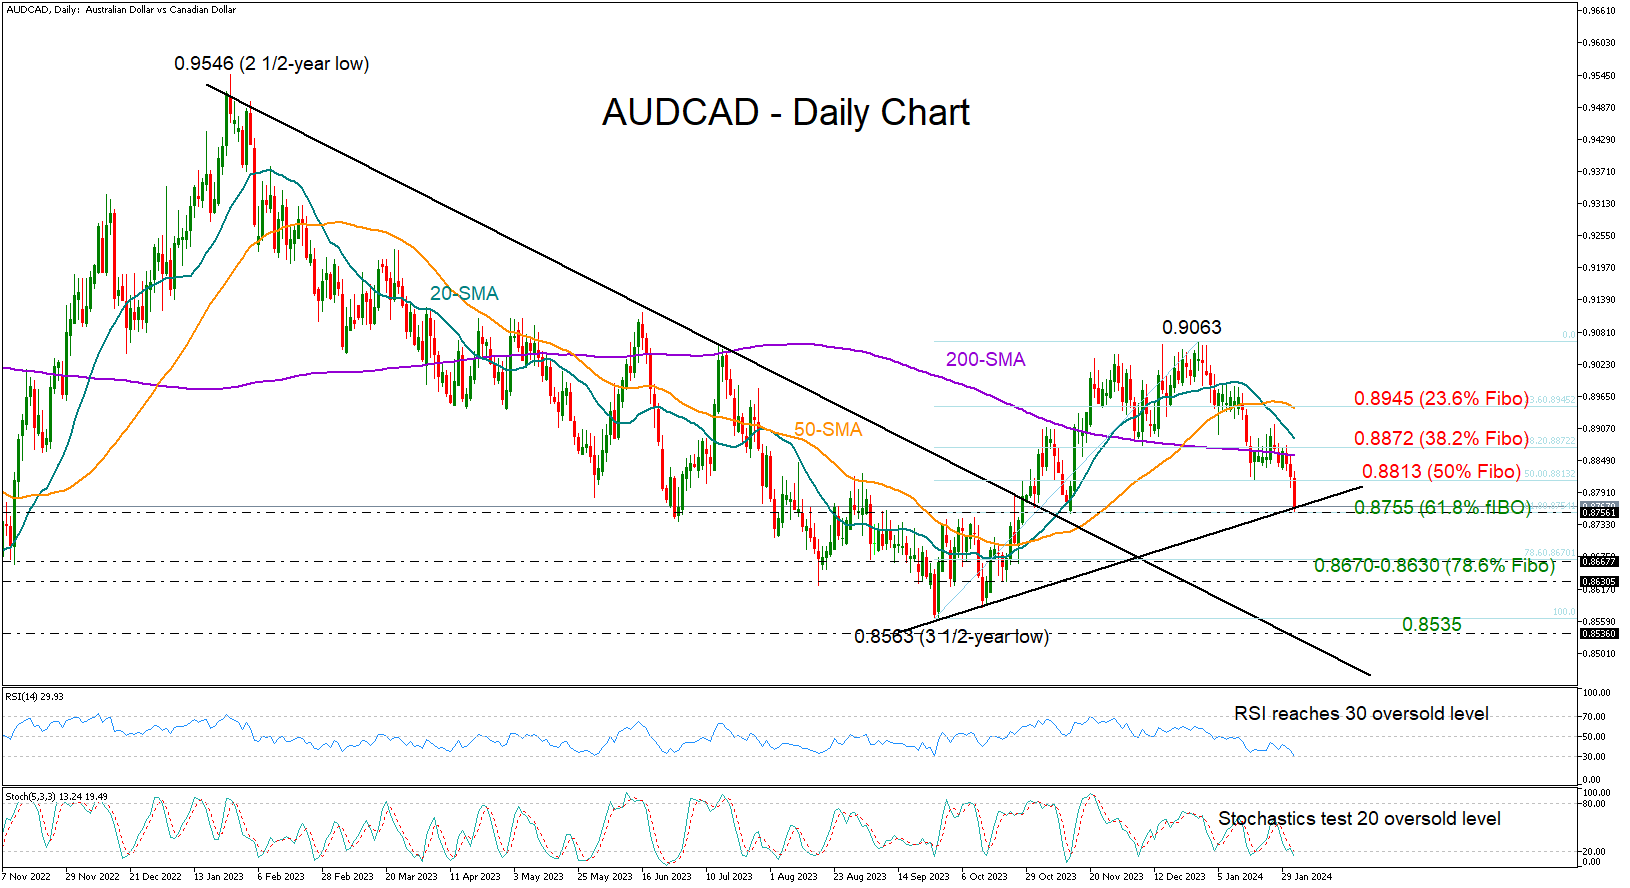
AUDCAD erased more than half of its October-December upleg to find support around the November 13 low of 0.8755, which overlaps with the 61.8% Fibonacci retracement level of the bullish wave.
Both the RSI and the stochastic oscillators hint at oversold conditions, signaling that the bearish action could soon stabilize. If that proves to be the case, the bulls might again fight for a close above the 50% Fibonacci level of 0.8813 and then battle the tricky region around the 38.2% Fibonacci mark of 0.8872, where the 200- and 20-day simple moving averages (SMAs) are converging towards. A successful extension higher could boost sentiment, lifting the price up to the 23.6% Fibonacci of 0.8945.
Should the floor at 0.8755 collapse, the price could tumble towards the 78.6% Fibonacci of 0.8670 and perhaps test the 0.8630 constraining zone too. A break below the latter point could pick up steam towards the 3½-year low of 0.8563 registered in September and then examine the broken resistance trendline drawn from January 2023 at 0.8535.
In summary, the latest downfall in AUDCAD seems overdone, making an upside correction possible in the coming sessions. Yet, whether the pair will find enough buyers to overcome key resistance levels on the upside remains to be seen.


