
Key Highlights
- GBP/USD declined heavily below the 1.2650 support.
- It traded below a key contracting triangle with support at 1.2660 on the 4-hour chart.
- EUR/USD could attempt a recovery wave toward the 1.0820 resistance zone.
- The UK Construction PMI could increase from 46.8 to 47.3 in Jan 2023.
GBP/USD Technical Analysis
The British Pound started a fresh decline from the 1.2780 resistance zone against the US Dollar. GBP/USD traded below the 1.2720 support to enter a bearish zone.
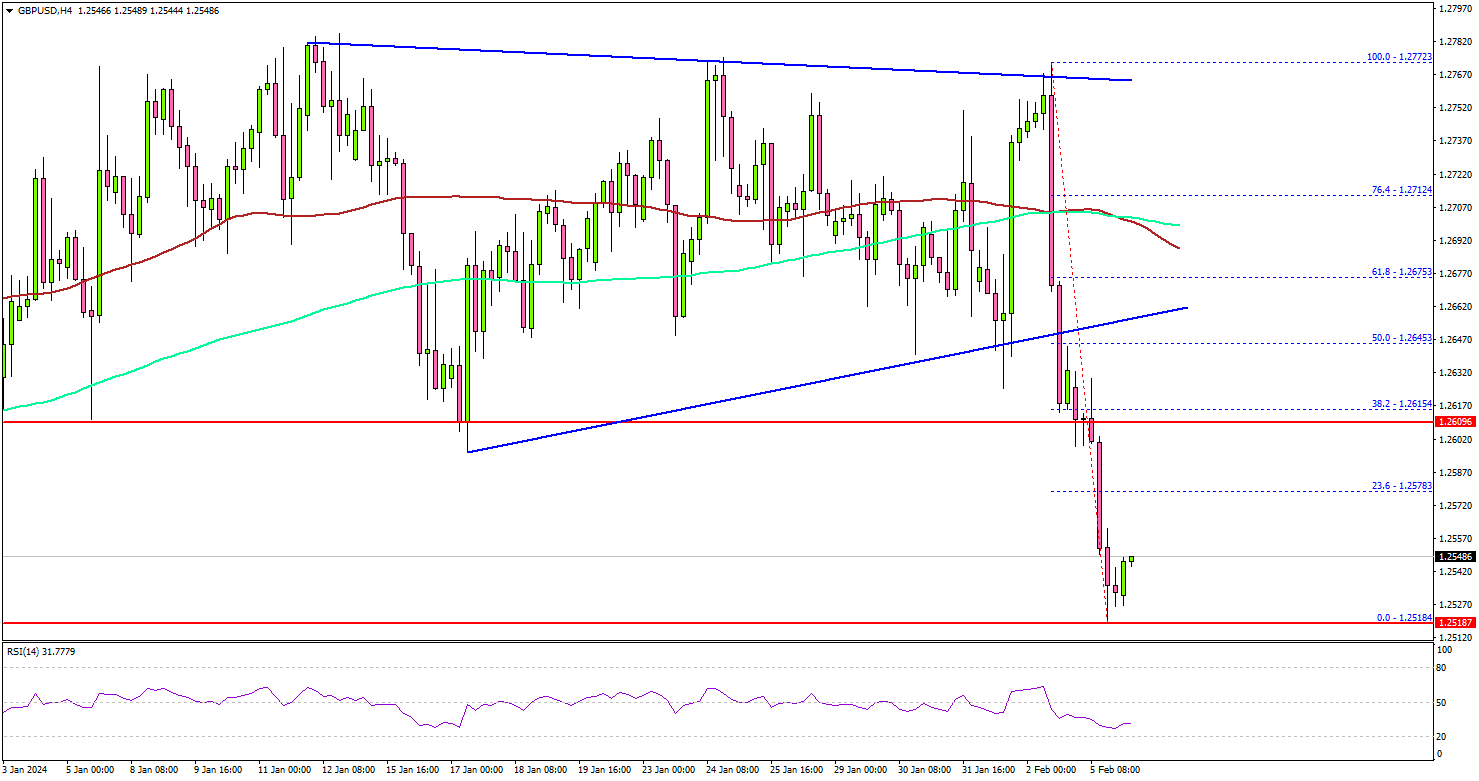
Looking at the 4-hour chart, the pair settled below the 1.2700 zone, the 100 simple moving average (red, 4 hours), and the 200 simple moving average (green, 4 hours).
The bears even pushed the pair below the 1.2650 support. Besides, it traded below a key contracting triangle with support at 1.2660 on the same chart. Finally, the pair spiked below 1.2550. It is now consolidating losses near the 1.2540 level.
Immediate support is near the 1.2525 level. The first major support sits near the 1.2500 level. The next major support sits at 1.2440, below which the pair might gain bearish momentum.
In the stated case, the pair could even revisit the 1.2400 support level. On the upside, the bulls are facing hurdles near the 1.2580 level. The next key resistance is near the 1.2620 level. A close above the 1.2620 zone could open the doors for more upsides. The next stop for the bulls might be 1.2650. Any more gains might send GBP/USD toward the 1.2750 level.
Looking at EUR/USD, the pair tumbled toward the 1.0720 level and might soon attempt a recovery wave in the near term.
Economic Releases
- UK’s Construction PMI for Jan 2023 – Forecast 47.3, versus 46.8 previous.


