
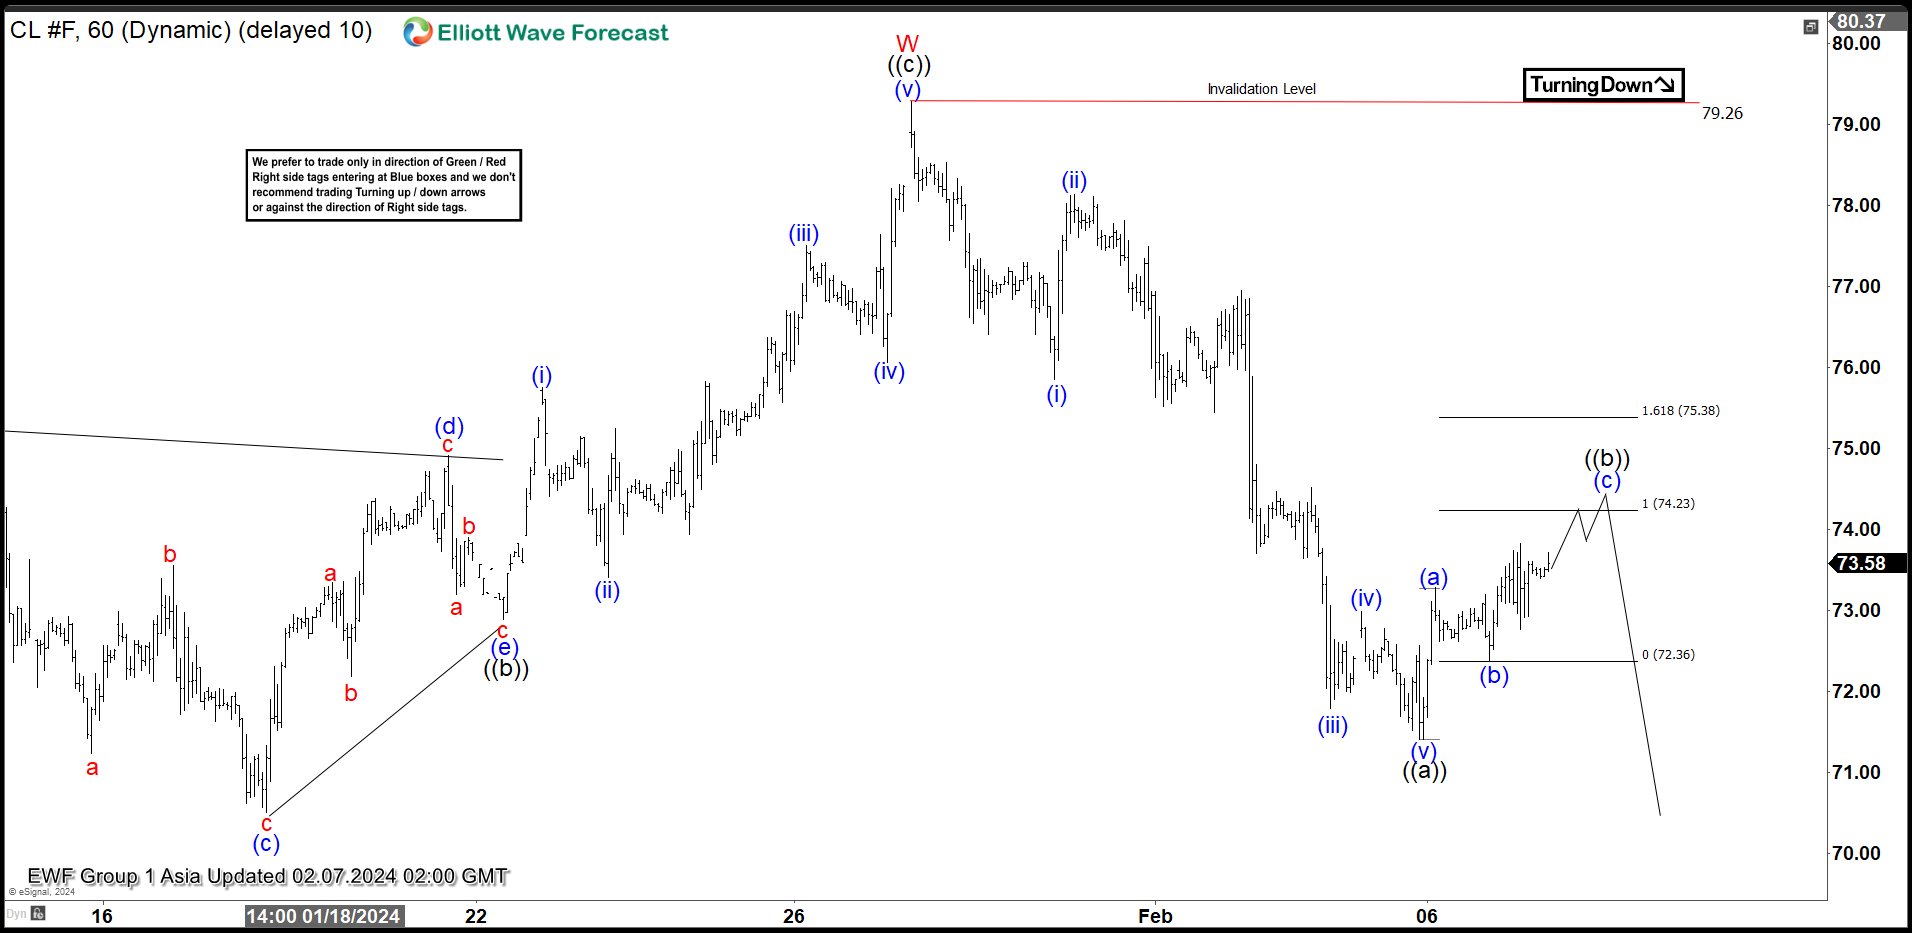
Short Term Elliott Wave view in Oil suggests that rally from 12.13.2023 low is unfolding as a double three Elliott Wave structure. Up from 12.13.2023 low, wave ((a)) ended at 76.18 and dips in wave ((b)) ended at 72.89. Wave ((c)) higher unfolded as a 5 waves where wave (i) ended at 75.75 and wave (ii) ended at 73.41. Rally in wave (iii) ended at 77.51, and pullback in wave (iv) ended at 76.06. Wave (v) higher ended at 79.26 which completed wave ((c)) of W in higher degree.
Pullback in wave X is currently in progress with internal subdivision as a zigzag Elliott Wave structure. Down from wave W, wave (i) ended at 75.85 and rally in wave (ii) ended at 78.14. Oil then extended lower in wave (iii) towards 71.79 and wave (iv) ended at 72.98. Final leg wave (v) ended at 71.41 which completed wave ((a)). Wave ((b)) rally is in progress as a zigzag. Up from wave (a)), wave (a) ended at 73.28 and wave (b) ended at 72.38. Expect wave (c) higher to complete at 74.23 – 75.38 area and this should complete wave ((b)) in higher degree. From this area, expect sellers to appear and Oil to extend lower. Near term, as far as pivot at 79.26 high stays intact, expect rally to fail in 3, 7, or 11 swing for further downside.
Oil 60 Minutes Elliott Wave Chart
Oil (CL_F) Elliott Wave Video


By loading the video, you agree to YouTube’s privacy policy.
Learn more


)%20ended%20at%2076.18%20and%20dips%20in%20wave%20((b))%20ended%20at%2072.89.%20Wave%20((c))%20higher%20unfolded%20as%20a%205%20waves%20where%20wave%20(i)%20ended%20at%2075.75%20and%20wave%20(ii)%20ended%20at%2073.41.%20Rally%20in%20wave%20(iii)%20ended%20at%2077.51,%20and%20pullback%20in%20wave%20(iv)%20ended%20at%2076.06.%20Wave%20(v)%20higher%20ended%20at%2079.26%20which%20completed%20wave%20((c))%20of%20W%20in%20higher%20degree.)