
- NZDUSD claims 200-day SMA and descending trendline
- But the pair fails to rally, extending sideways move
- Oscillators improve but remain in negative territories
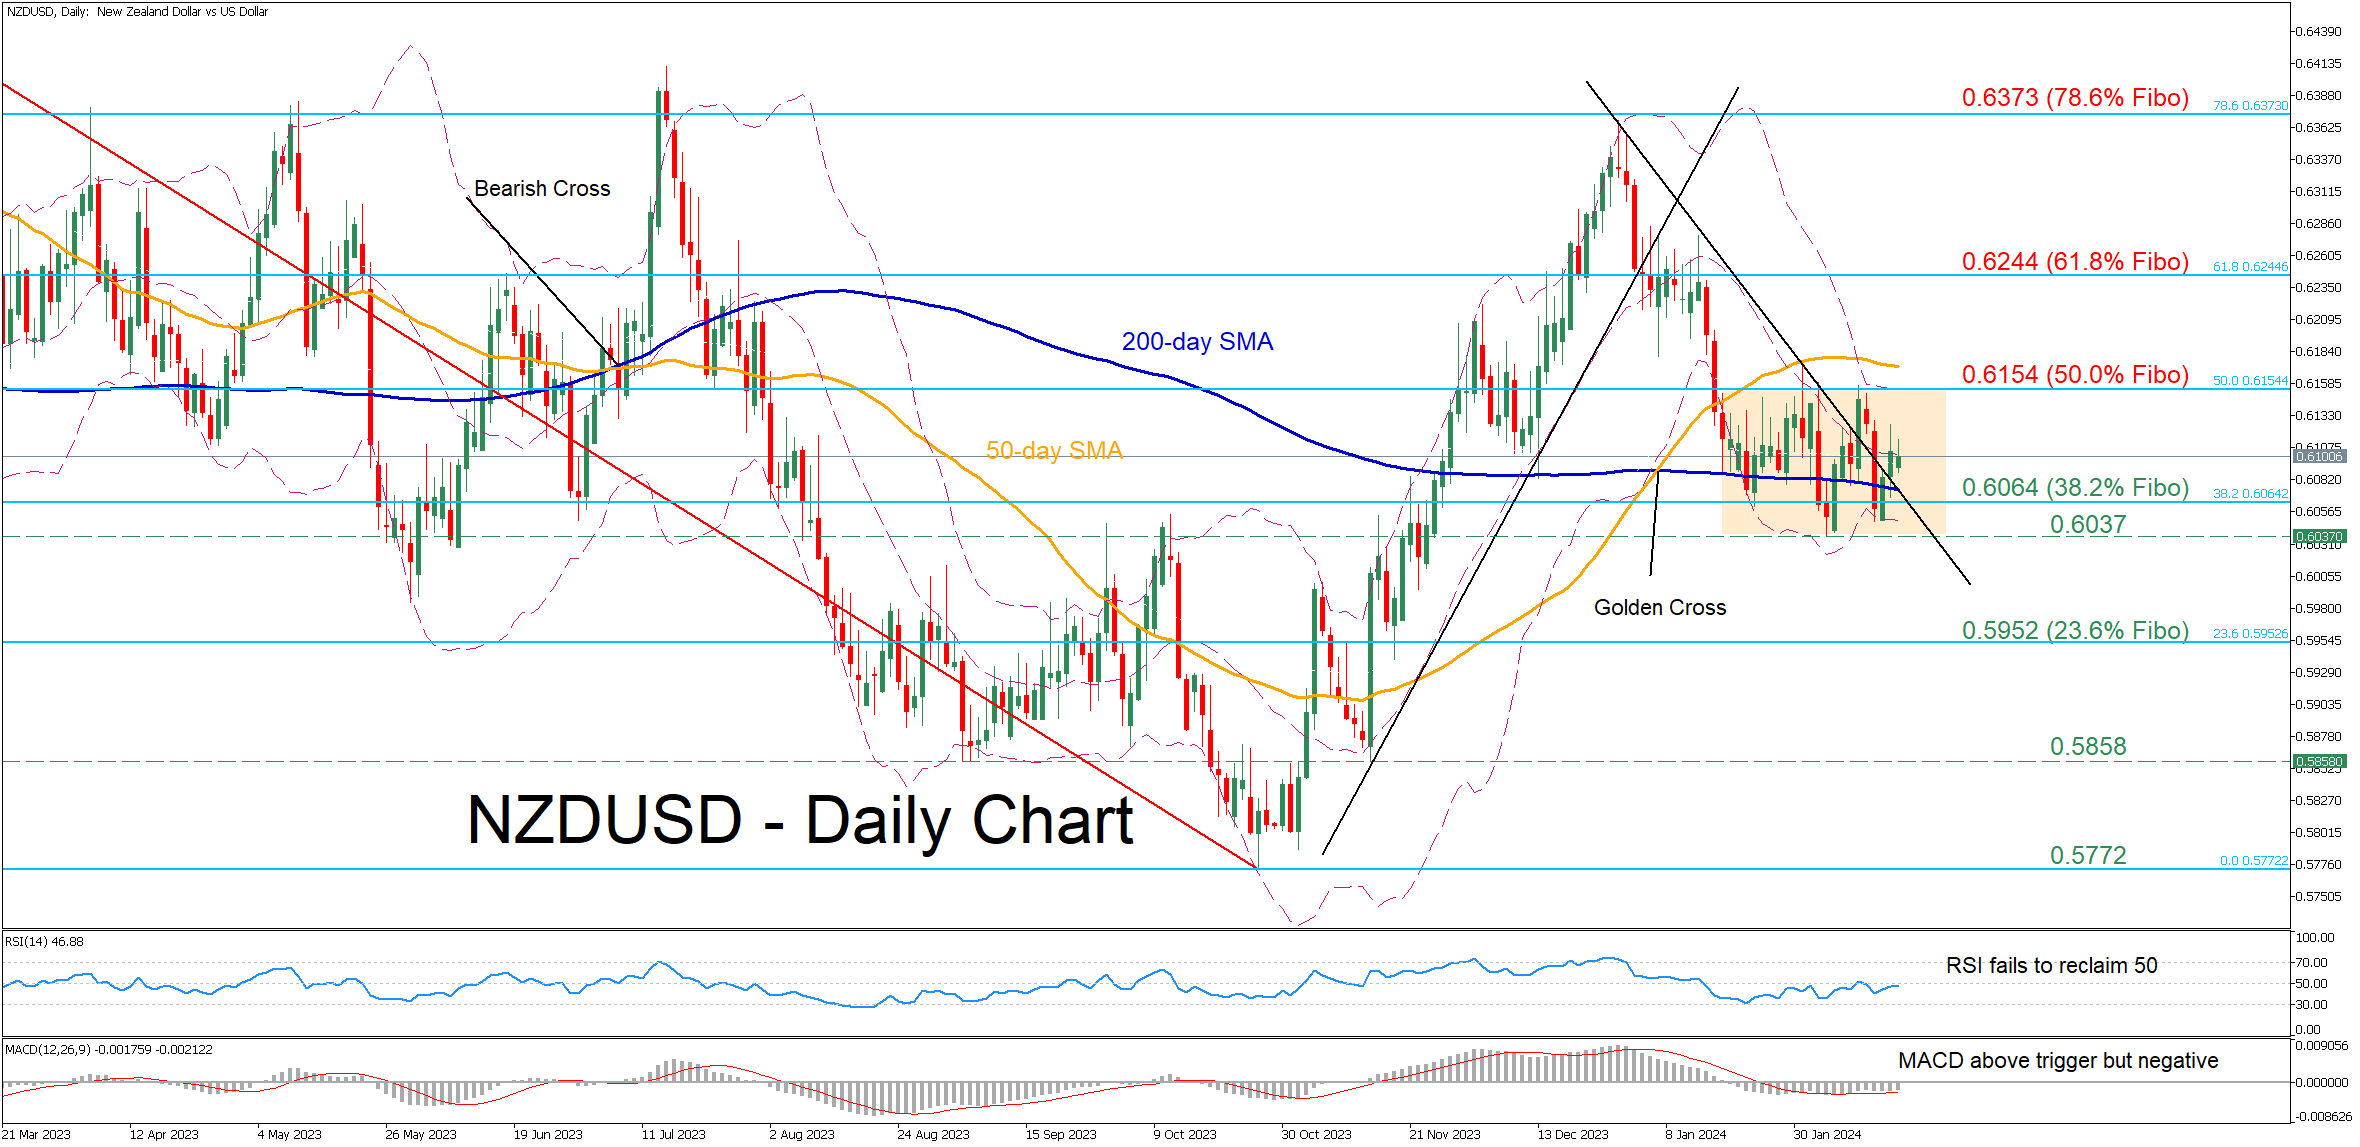
NZDUSD entered a downtrend after getting rejected at the 78.6% Fibonacci retracement of the 0.6536-0.5772 downleg in December. However, the pair has adopted a rangebound pattern around the 200-day simple moving average (SMA) since mid-January, while the latest jump above it has failed to trigger a strong advance.
Given that both the RSI and MACD are within their negative zones, the price might drop again below the 200-day SMA and challenge the 38.2% Fibo of 0.6064. Diving beneath that floor, the pair could descend towards the recent two-month bottom of 0.6037. A violation of that region could set the stage for the 23.6% Fibo of 0.5952.
On the flipside, should the recovery resume, immediate resistance could be found at the 50.0% Fibo of 0.6154. Further advances could then cease around the 61.8% Fibo of 0.6244. Piercing through that hurdle, the price might test the 78.6% Fibo of 0.6373, a region that capped the pair’s advance in December.
Overall, despite the break above both the 200-day SMA and the downward sloping trendline, NZDUSD continues to hover within its rangebound structure. Hence, in the case that the rebound resumes, the focus will shift on the 50.0% Fibo of 0.6154.


%20since%20mid-January,%20while%20the%20latest%20jump%20above%20it%20has%20failed%20to%20trigger%20a%20strong%20advance.)