
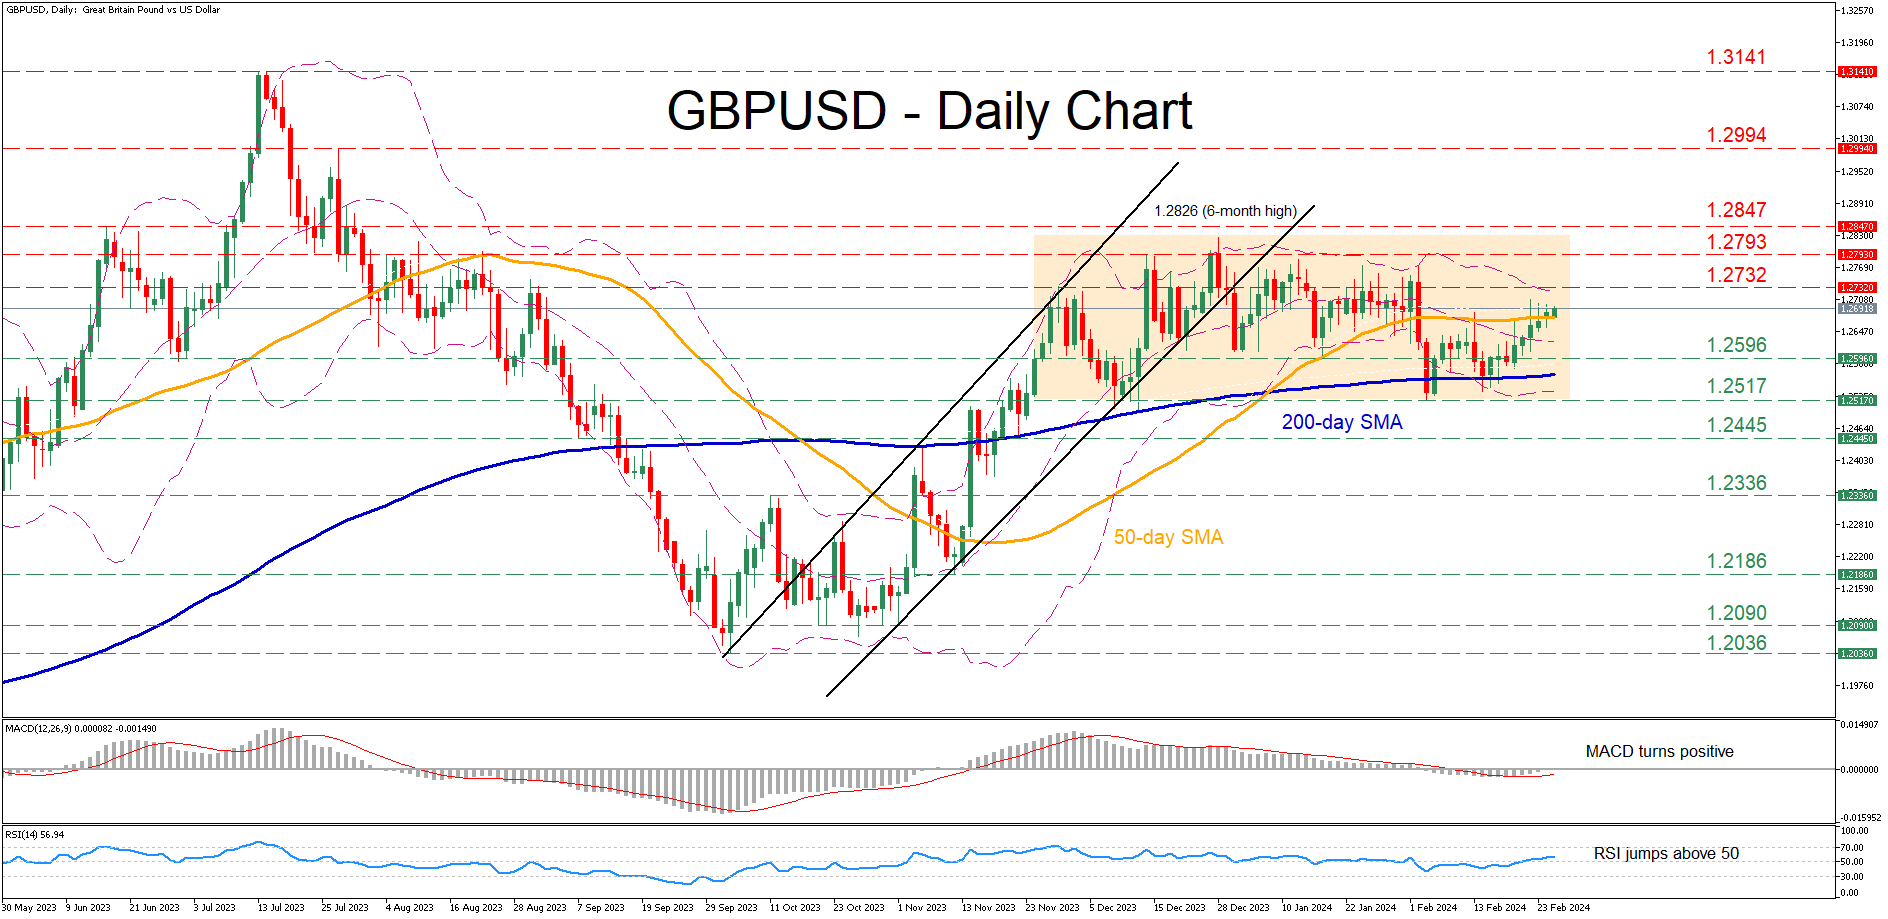
- GBPUSD bounces off 200-day SMA and regains ground
- But its advance meets strong resistance at 50-day SMA
- Momentum indicators turn slightly positive
GBPUSD has been stuck in a rangebound pattern since mid-November, unable to adopt a clear directional impetus. Despite falling towards the lower end of the range in February, the pair managed to fight back after encountering strong support at the 200-day simple moving average (SMA).
Given that the short-term oscillators are providing cautiously positive signals, the bulls might attempt to conquer the 50-day SMA before attacking the November high of 1.2732. Should that barricade fail, the spotlight could turn to the December resistance of 1.2793 ahead of the six-month peak of 1.2826. Surpassing that zone, the price may test the June 2023 peak of 1.2847.
On the flipside, if the pair reverses back lower, the January support of 1.2596 could act as the first line of defence. A downside violation of that region could open the door for the 2024 low of 1.2517. Further declines could then cease at 1.2445, a region that provided both support and resistance throughout 2023.
In brief, GBPUSD remains a prisoner within its sideways range, with the 50-day SMA currently curbing its upside. Therefore, a clear break above the latter could spark an advance towards fresh multi-month peaks.


.)