
Key Highlights
- GBP/USD failed to clear the 1.2700 resistance zone.
- It traded below a key bullish trend line with support at 1.2650 on the 4-hour chart.
- EUR/USD is consolidating above the 1.0780 support.
- Bitcoin rallied over 10% and cleared the $60,000 resistance.
GBP/USD Technical Analysis
The British Pound started a decent increase from the 1.2535 zone against the US Dollar. GBP/USD gained pace for a move above the 1.2620 and 1.2650 resistance levels.
Looking at the 4-hour chart, the pair struggled to clear the 1.2700 resistance. A high was formed near 1.2709 and the pair reacted to the downside. There was a break below a key bullish trend line with support at 1.2650 and the 200 simple moving average (green, 4-hour).
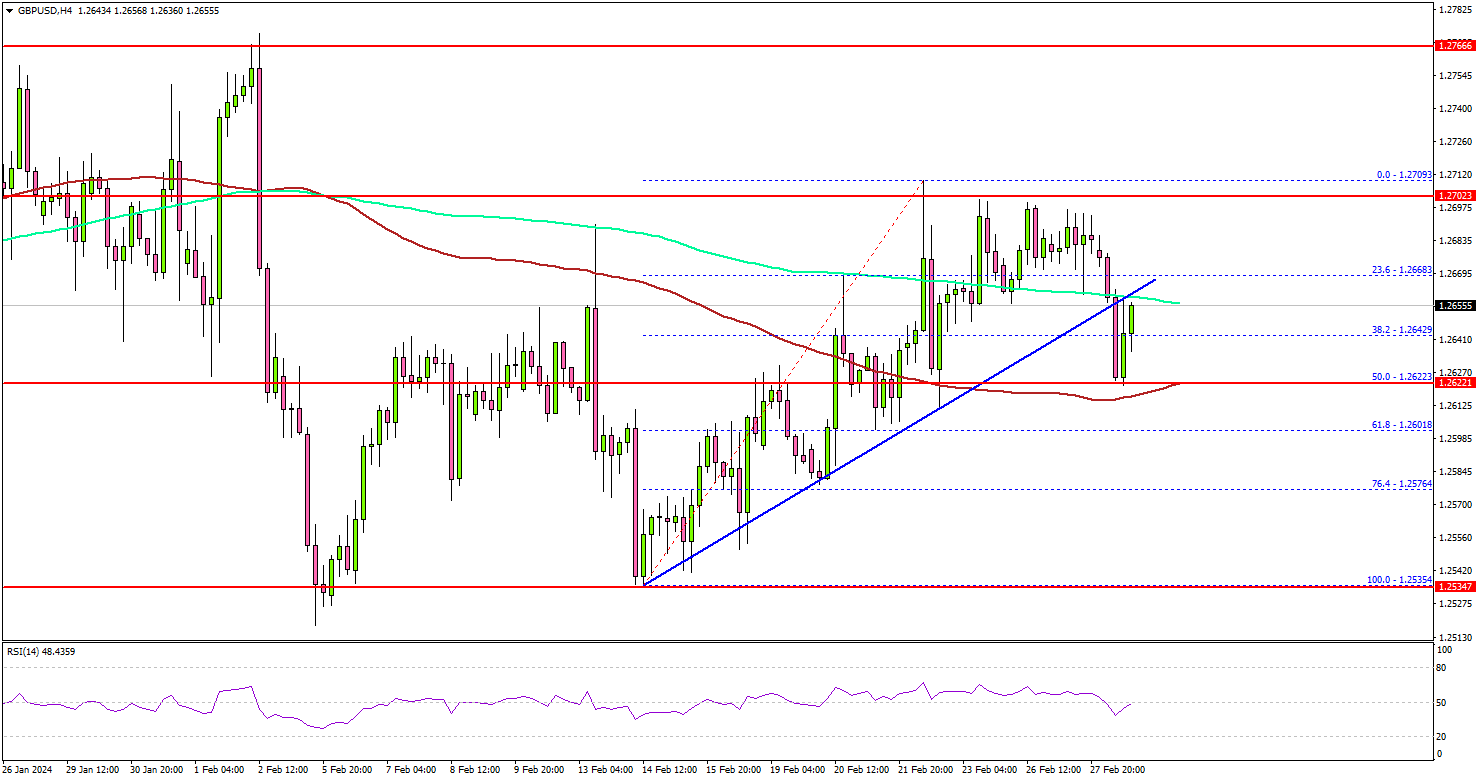
The pair spiked toward the 50% Fib retracement level of the upward move from the 1.2535 swing low to the 1.2709 high. It also tested the 100 simple moving average (red, 4-hour).
If there is a downside break below the 1.2620 support, the pair could decline toward the 1.2575 level. Any more gains might send GBP/USD toward 1.2535.
On the upside, the pair is facing resistance near the 1.2685 level. The main resistance is near 1.2700. A close above the 1.2700 zone could open the doors for more upsides. The next stop for the bulls might be 1.2765.
Looking at Bitcoin, there was a strong increase, and the bulls were able to pump the price above the $60,000 resistance. The next key resistance sits at $62,500.
Economic Releases
- US Personal Income for Jan 2024 (MoM) – Forecast +0.4%, versus +0.3% previous.
- US Pending Home Sales for Jan 2024 (YoY) – Forecast +1%, versus +8.3% previous.


