
- NZDUSD gets rejected after claiming 50-day SMA
- But the decline meets strong support at 200-day SMA
- Oscillators remain in their negative territories
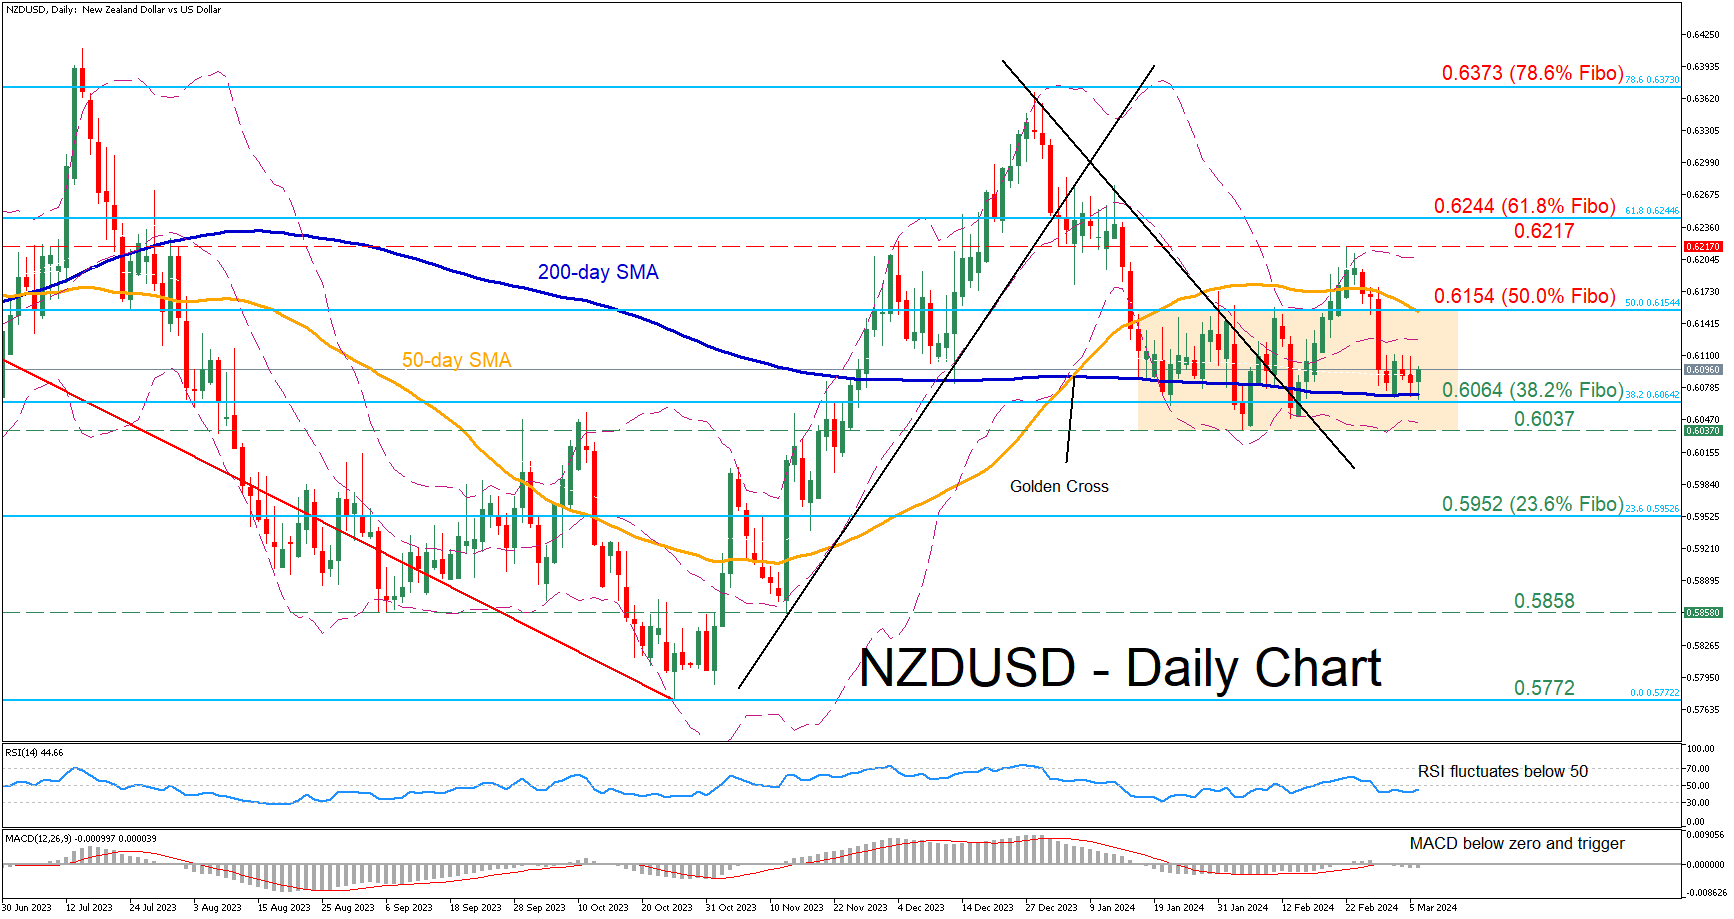
NZDUSD had been in a downtrend since its rejection at 0.6373, which is the 78.6% Fibonacci retracement of the 0.6536-0.5772 region. Despite the pair’s attempt for recovery and its temporary break above the 50-day simple moving average (SMA), it reversed back within its short-term sideways pattern.
Given that both the RSI and MACD are tilted to the downside, the price might drop below the 200-day SMA and challenge the 38.2% Fibo of 0.6064. Sliding beneath that floor, the pair could descend towards the 2024 bottom of 0.6037. A violation of that region could set the stage for the 23.6% Fibo of 0.5952.
On the flipside, should the pair rotate back higher, immediate resistance could be found at the 50.0% Fibo of 0.6154, which overlaps with the 50-day SMA. Conquering this barricade, the bulls may attack the recent rejection region of 0.6217. Further advances could then cease around the 61.8% Fibo of 0.6244.
Overall, despite the break above the 50-day SMA, NZDUSD reversed back within its rangebound structure as the 200-day SMA provided solid support. Hence, the consolidation phase is likely to resume and hold for as long as the SMAs hold their ground.


,%20it%20reversed%20back%20within%20its%20short-term%20sideways%20pattern.)