
In the past two weeks, the US SPX 500 has continued its pace of acceleration and hit another fresh all-time of 5,150 on Monday, 4 March.
However, under the surface, there are signs of weakness from a sector rotation perspective. The SPX 500 is broken down into 11 key sectors and relative performance among the sectors such as “aggressive” over “defensive” tends to form a leading indication towards the movement of the S&P 500 based on past price actions.
Potential underperformance of Consumer Discretionary over Consumer Staples
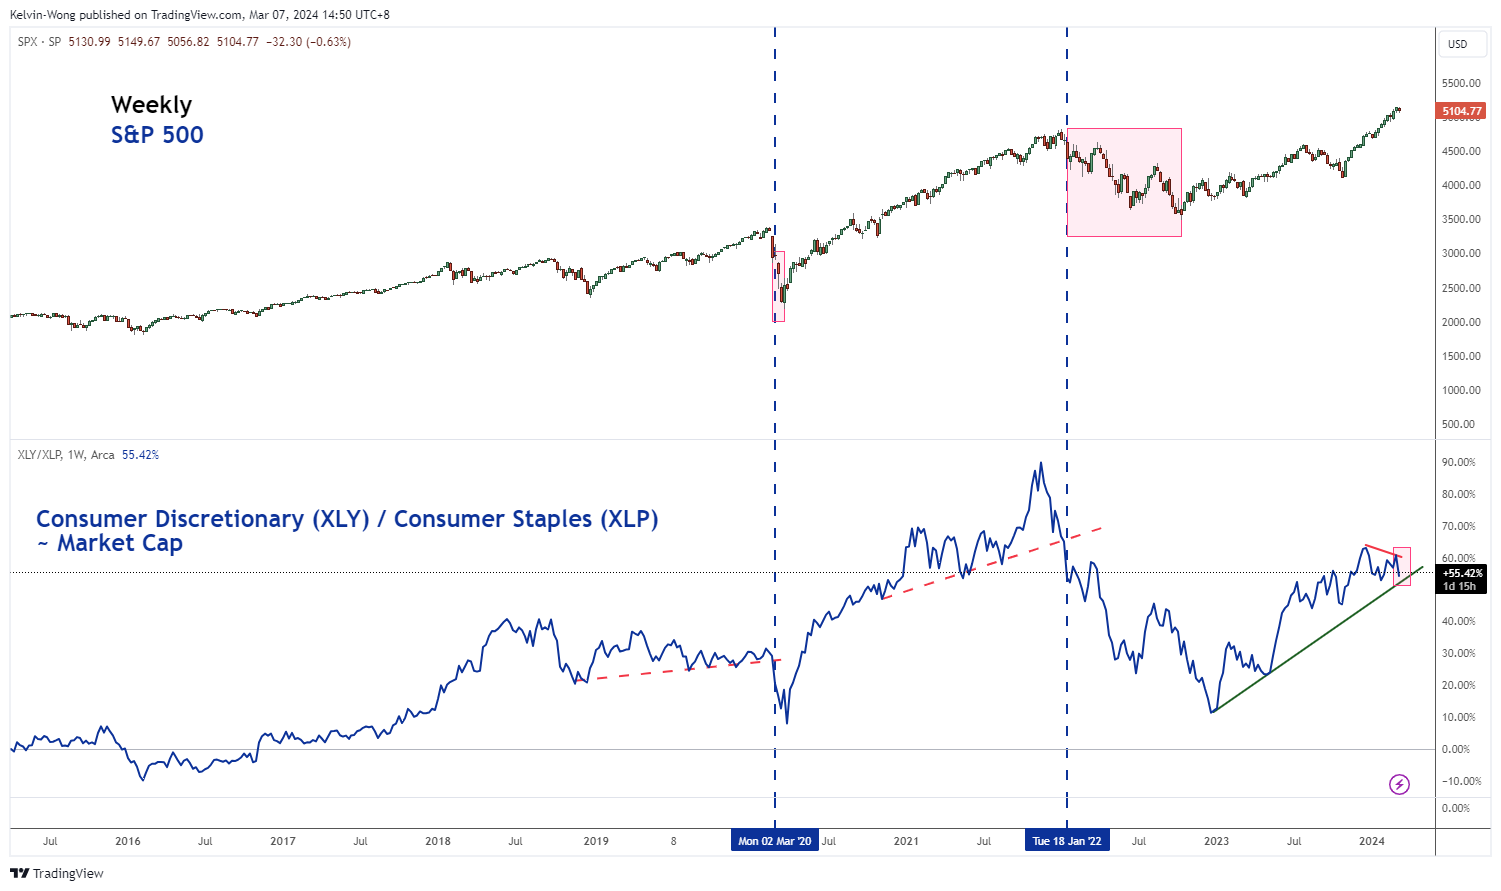
Fig 1: S&P Consumer Discretionary/Consumer Staples ratio major trend as of 7 Mar 2024 (Source: TradingView, click to enlarge chart)
The Consumer Discretionary sector is considered as a high beta “aggressive” sector as its performance in general moves directly with the cyclical trend of the economy. In contrast, the Consumer Staples sector is a lower beta sector that is being labeled as “defensive” because its movement is less synchronized directly with a typical economic cycle.
By plotting the ratio of the Consumer Discretionary sector exchange-traded fund (XLY) over the Consumer Staples sector exchange-traded fund (XLP), we can have a visual quantitative relative performance historical chart.
Next, overlayed the weekly ratio chart of XLY/XLP with the SPX 500 (see Fig 1), we can detect two recent underperformances of the XLY over XLP (the ratio broke below its support) that led to a multi-week corrective decline inflicted on the SPX 500.
On the week of 2 March 2020, the XLY/XLP ratio broke below its key support, and thereafter the S&P 500 shed -22%. The next occasion was on the week of 18 January 2022 where the XLY/XLP broke down below its support followed by a -18% decline in the SPX 500 over the next nine months.
Right now, the current price actions of the XLY/XLP ratio have inched lower in the past two weeks and are about to seek a retest on its key support in place since the week of 19 December 2022. Also, before the current retest of its support, it has shaped a lower high which increases the risk of a looming underperformance of Consumer Discretionary over Consumer Staples that in turn may trigger a potential multi-week corrective decline on the SPX 500.
Watch the key resistance of 5,150 on the SPX 500
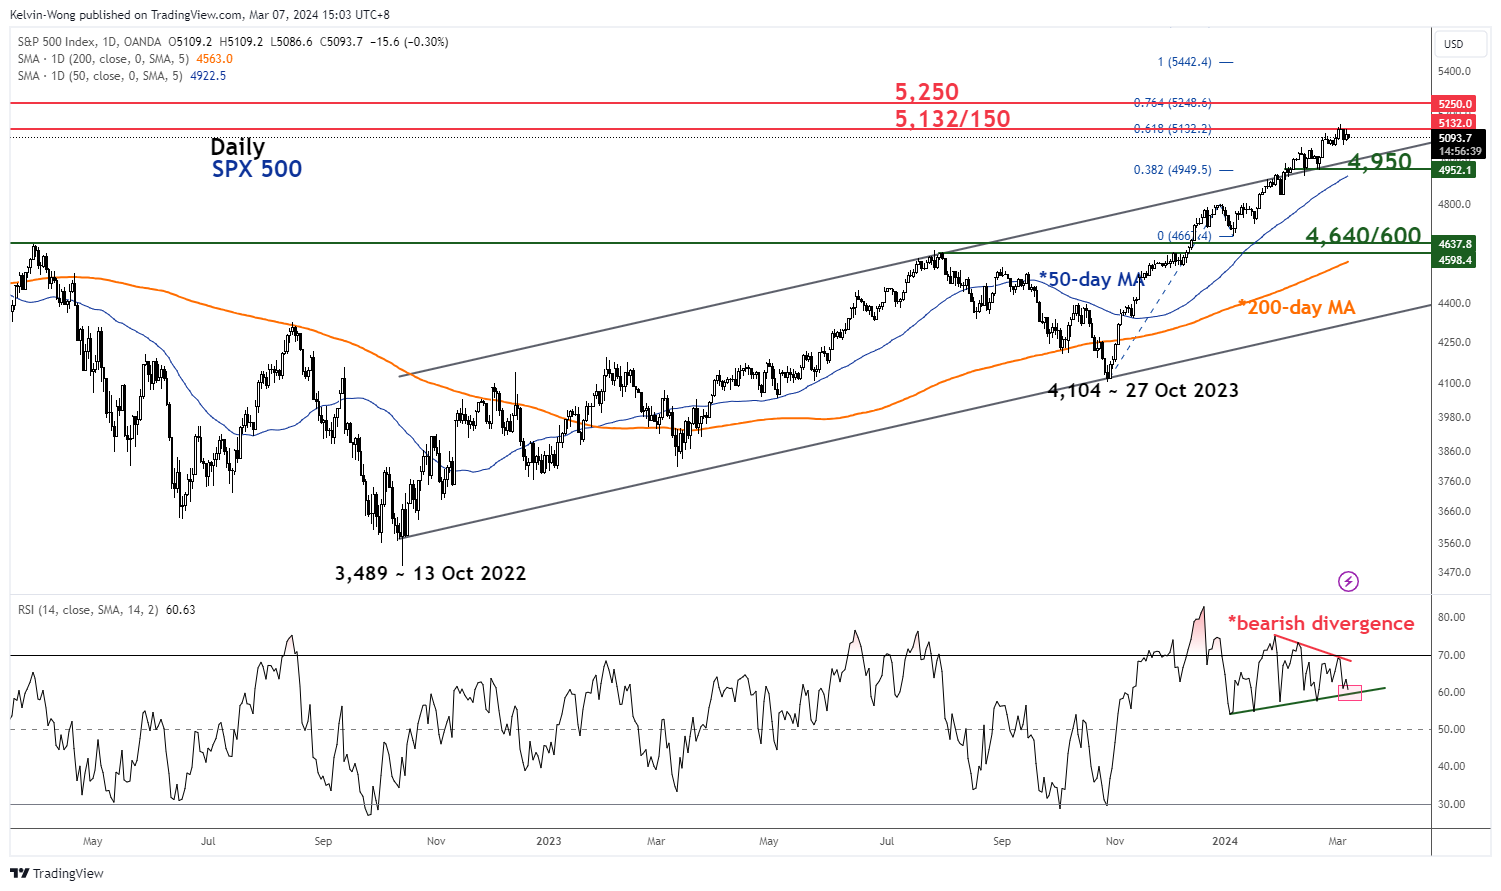
Fig 2: US SPX 500 medium-term & major trends as of 7 Mar 2024 (Source: TradingView, click to enlarge chart)
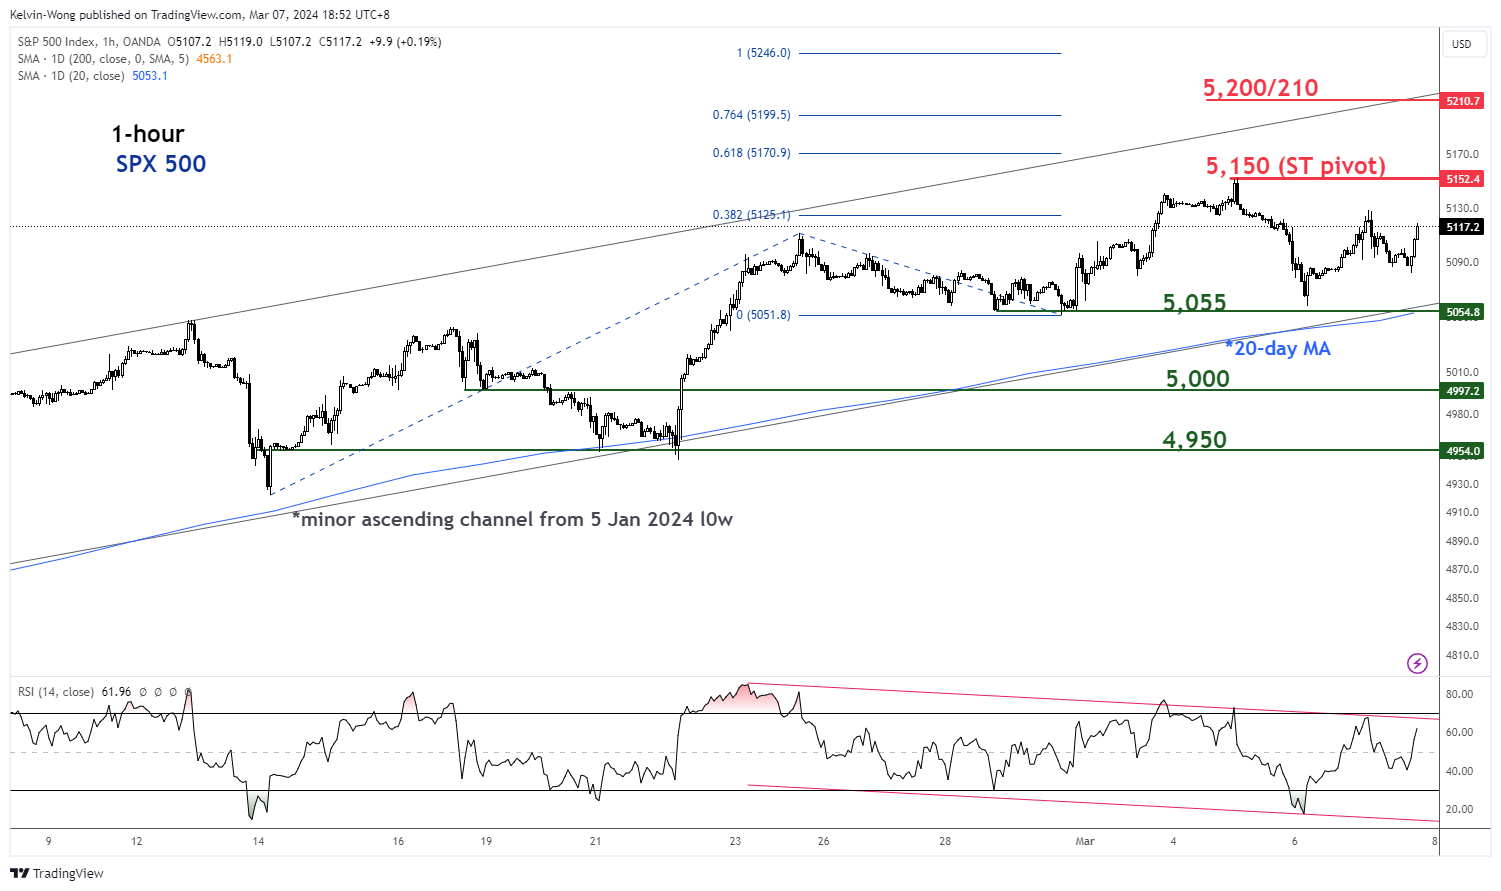
Fig 3: US SPX 500 short-term trend as of 7 Mar 2024 (Source: TradingView, click to enlarge chart)
The daily RSI momentum indicator of the SPX 500 has flashed out a persistent bearish divergence condition at its overbought region since 9 February 2024 which indicates a slowdown in medium-term upside momentum.
If the 5,150 key pivotal resistance on the SPX 500 is not surpassed to the upside, and a break below the 5,055 near-term support (also the 20-day moving average) may trigger the start of a multi-week corrective decline that exposes the next intermediate supports at 5,000 and 4,950 in the first step.
On the flip side, a clearance above 5,150 invalidates the bearish scenario for the continuation of the impulsive upmove sequence for the next intermediate resistance to come in at 5,200/210.


