
- USDCHF consolidates its 2024 uptrend
- Short-term bias weakens, but a rebound is still possible
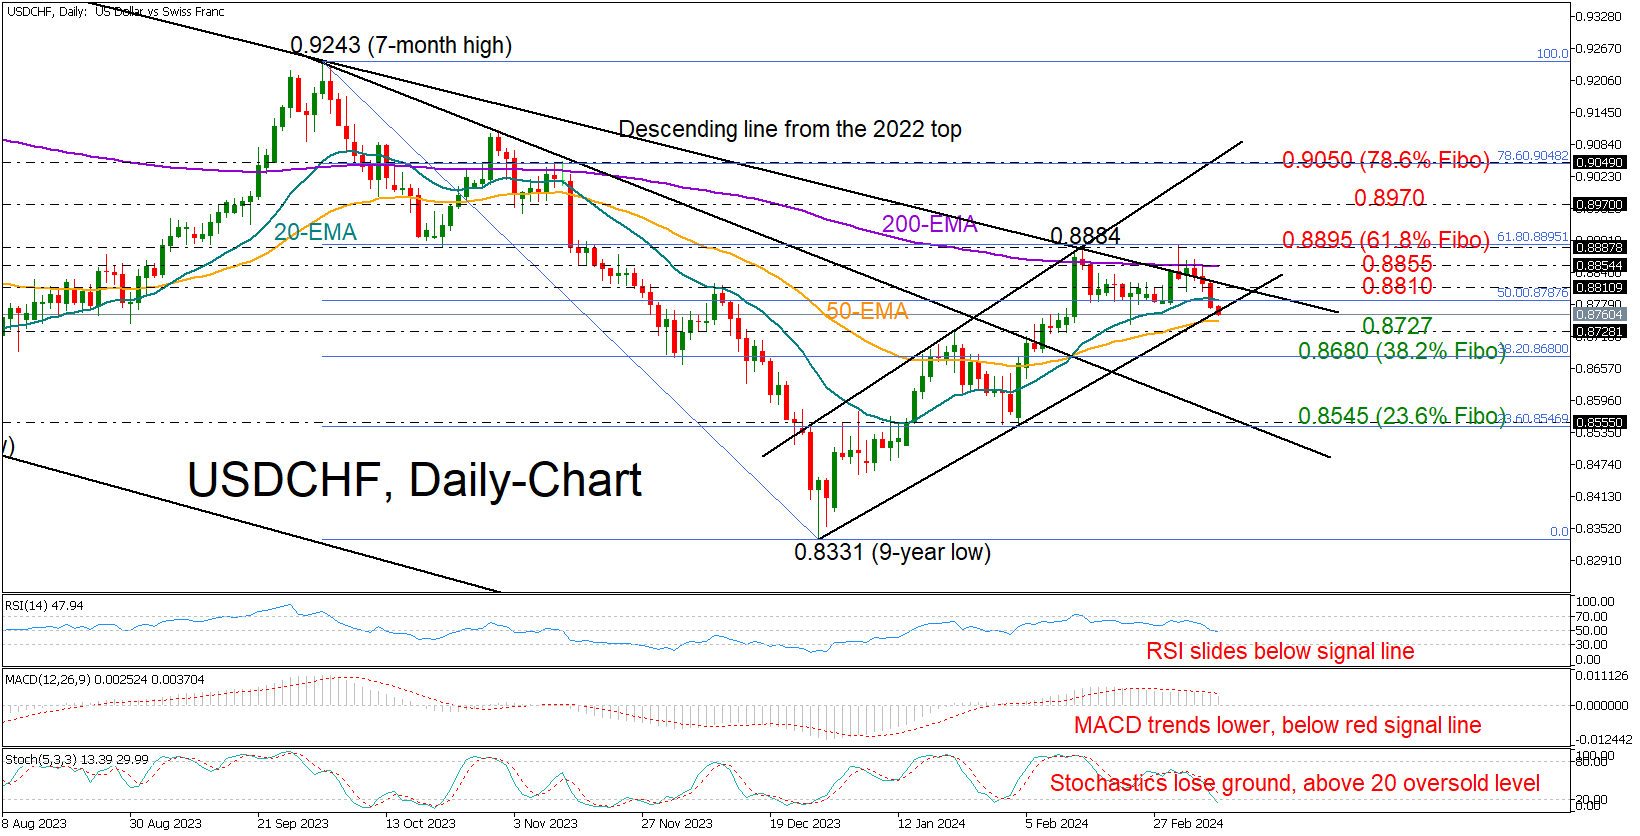
USDCHF topped twice around February’s high of 0.8884 and the 200-day exponential moving average (EMA), increasing fears that the 2024 upleg might have peaked, especially after the tick below the nearby 0.8780 support region on Thursday.
However, the ascending trendline from December’s low is still intact and is currently being examined at 0.8765, with the possibility that January’s high at 0.8727 could also mitigate pressures. The bearish wave could gain momentum if the latter is breached, causing the price to approach the 0.8680 constraining zone. This zone represents the 38.2% Fibonacci retracement of the October-December downleg. A steeper decline could head for the 23.6% Fibonacci level of 0.8545.
The above bearish scenario is backed by the technical indicators, as the RSI is poised to fall below 50 and the MACD is consistently below its signal line. The stochastic oscillator is also maintaining its negative trajectory above its 20 oversold level.
On the upside, the pair will have to pierce through the 0.8810-0.8855 region, which includes the long-term resistance trendline from November 2011, in order to re-challenge the double-top region and the 61.8% Fibonacci of 0.8895. A successful penetration higher could bolster buying appetite towards the 0.8970 barrier and then up to the 78.6% Fibonacci bar of 0.9050.
In short, the uptrend of USDCHF in 2024 has plateaued, but the downside risks may remain balanced as long as the price stays above 0.8730.


,%20increasing%20fears%20that%20the%202024%20upleg%20might%20have%20peaked,%20especially%20after%20the%20tick%20below%20the%20nearby%200.8780%20support%20region%20on%20Thursday.)