
Key Highlights
- Gold rallied above the $2,120 and $2,180 resistance levels.
- It traded below a key rising channel with support at $2,170 on the 4-hour chart.
- EUR/USD and GBP/USD started a downside correction.
- Bitcoin price extended its rally above $72,000.
Gold Price Technical Analysis
Gold prices started a fresh increase from the $2,050 support against the US Dollar. The bulls cleared the $2,120 resistance to start a strong rally.
The 4-hour chart of XAU/USD indicates that the price settled above the $2,140 level, the 100 Simple Moving Average (red, 4 hours), and the 200 Simple Moving Average (green, 4 hours).
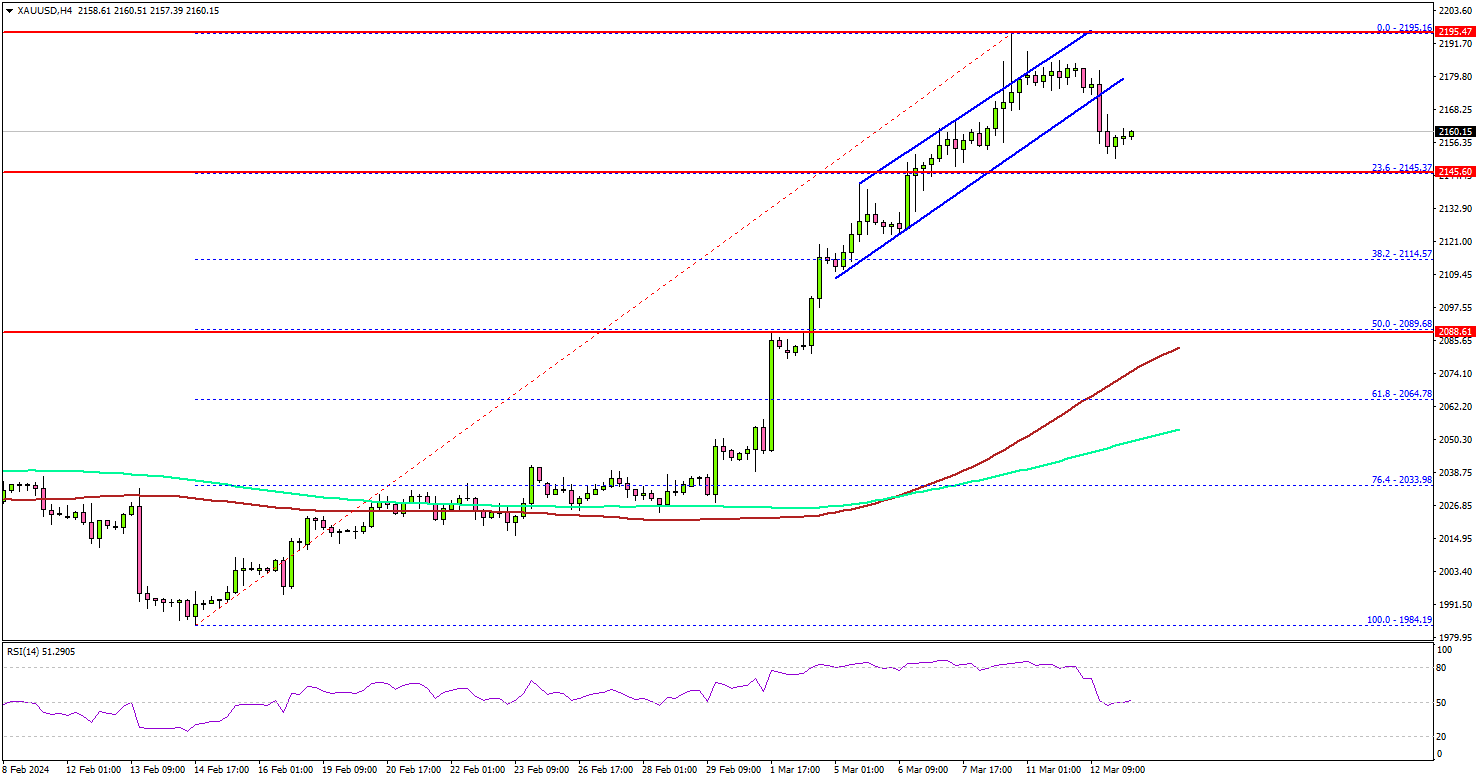
The bulls were able to pump the price above the $2,165 and $2,180 levels. Finally, the price traded close to the $2,200 level before the bears appeared. A high was formed at $2,195 and there was a minor downside correction.
There was a move below the $2,180 level. The price traded below a key rising channel with support at $2,170 on the same chart. Initial support is near the $2,145 level.
The first major support sits at $2,120. Any more losses might call for a move toward the $2,090 level or the 50% Fib retracement level of the upward move from the $1,984 swing low to the $2,195 high in the coming days.
Any more gains might open the doors for a test of $2,050. On the upside, the price might face resistance near the $2,180 level. The main resistance is now forming near $2,195 and $2,200.
Looking at Bitcoin, there was a strong upward move above the $70,000 and $72,000 levels. The next key resistance sits at $75,000.
Economic Releases to Watch Today
- UK Total Trade Balance for Jan 2024 – Forecast £-2.50B, versus £-2.603B previous.
- UK GDP for Jan 2024 (MoM) – Forecast +0.2%, versus -0.1% previous.


