
- EURGBP gets rejected near 50-day SMA after rebound
- Market structure develops into a bullish double bottom pattern
- Buyers need a rally above 0.8577 to dominate
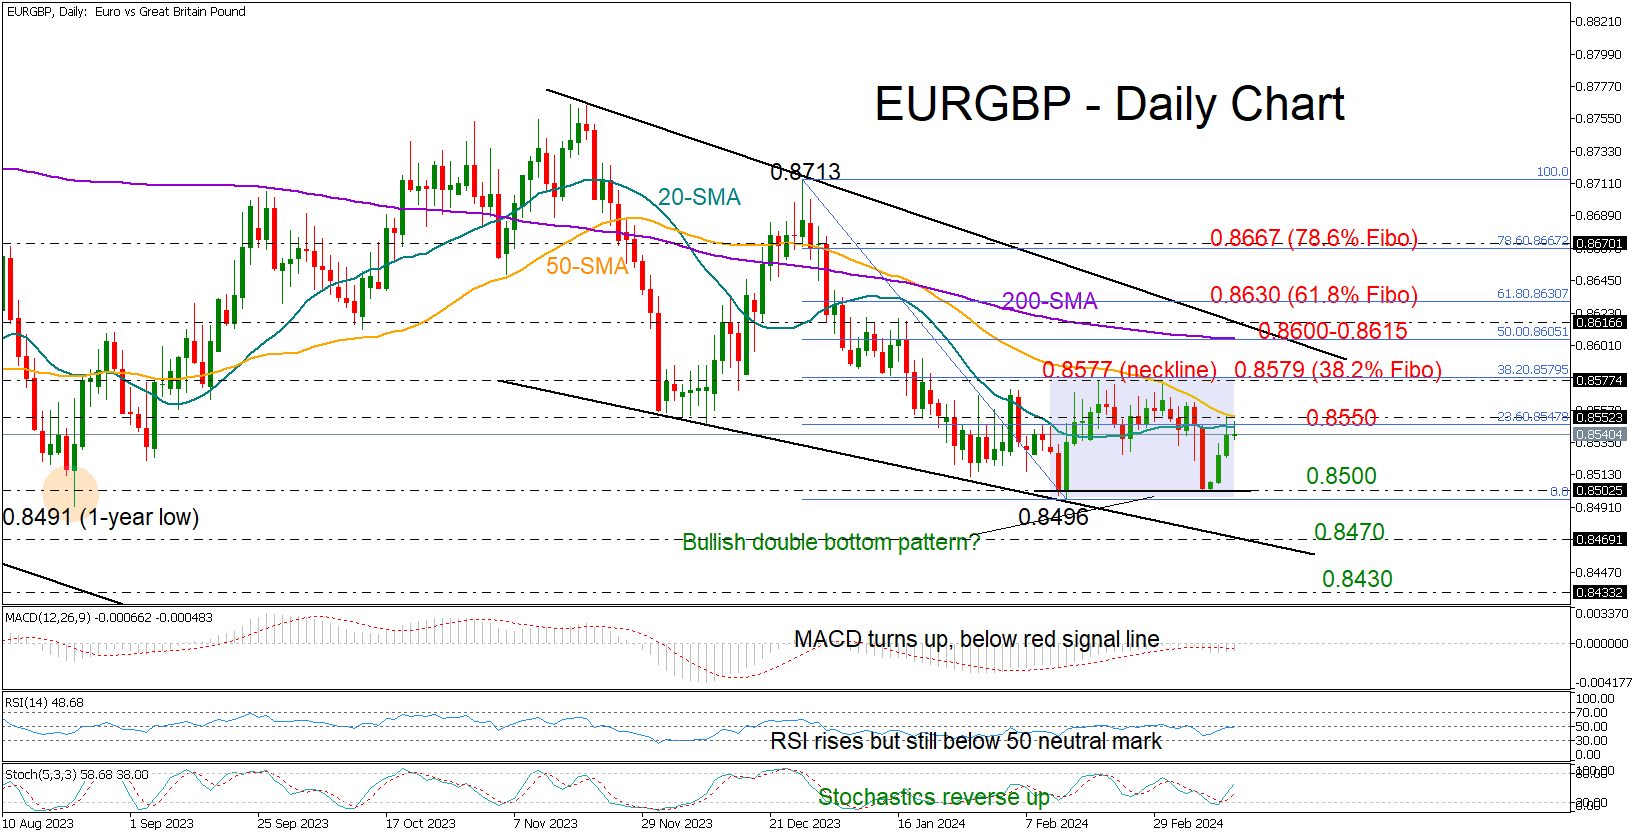
EURGBP could not surpass its 50-day simple moving average (SMA) at 0.8553 on Tuesday. However, the bullish double bottom pattern, which started to take shape around February’s base of 0.8500, might generate buying interest in the coming sessions in hopes the pair will soon stage an upside trend reversal.
The technical indicators have turned upwards, showing some improvement in market sentiment, but the RSI still needs to surpass its 50 neutral level. Moreover, the moving averages haven’t changed trajectory.
Traders should exercise caution until the price surpasses the 50-day SMA and closes above the neckline at 0.8577, which also aligns with the 38.2% Fibonacci retracement level. In the event that the bullish scenario materializes, the pair could be propelled strongly towards the 0.8600-0.8615 area. Should the pair breach the 61.8% Fibonacci of 0.8630 too, the recovery phase could pick up steam towards 0.8670.
Alternatively, if the price remains trapped below the 50-day SMA and pulls below the 23.6% Fibonacci of 0.8545, it might again seek support near the 0.8500 floor. A downtrend resumption beneath that threshold is expected to stabilize around the descending line from November at 0.8470 and then stretch into the 0.8400-0.8430 zone last seen in August 2022. Slightly lower, the August 2022 low of 0.8340 might next attract attention.
In brief, EURGBP set a strong foothold around the 0.8500 mark, which was also a major support zone in 2023, increasing optimism that the previous downward pattern will soon come to an end. That said, traders will wait for a confirmation above 0.8577.


%20at%200.8553%20on%20Tuesday.%20However,%20the%20bullish%C2%A0double%20bottom%20pattern,%20which%20started%20to%20take%20shape%20around%20February%E2%80%99s%20base%20of%200.8500,%20might%20generate%20buying%20interest%20in%20the%20coming%20sessions%20in%20hopes%20the%20pair%20will%20soon%20stage%20an%20upside%20trend%20reversal.)