
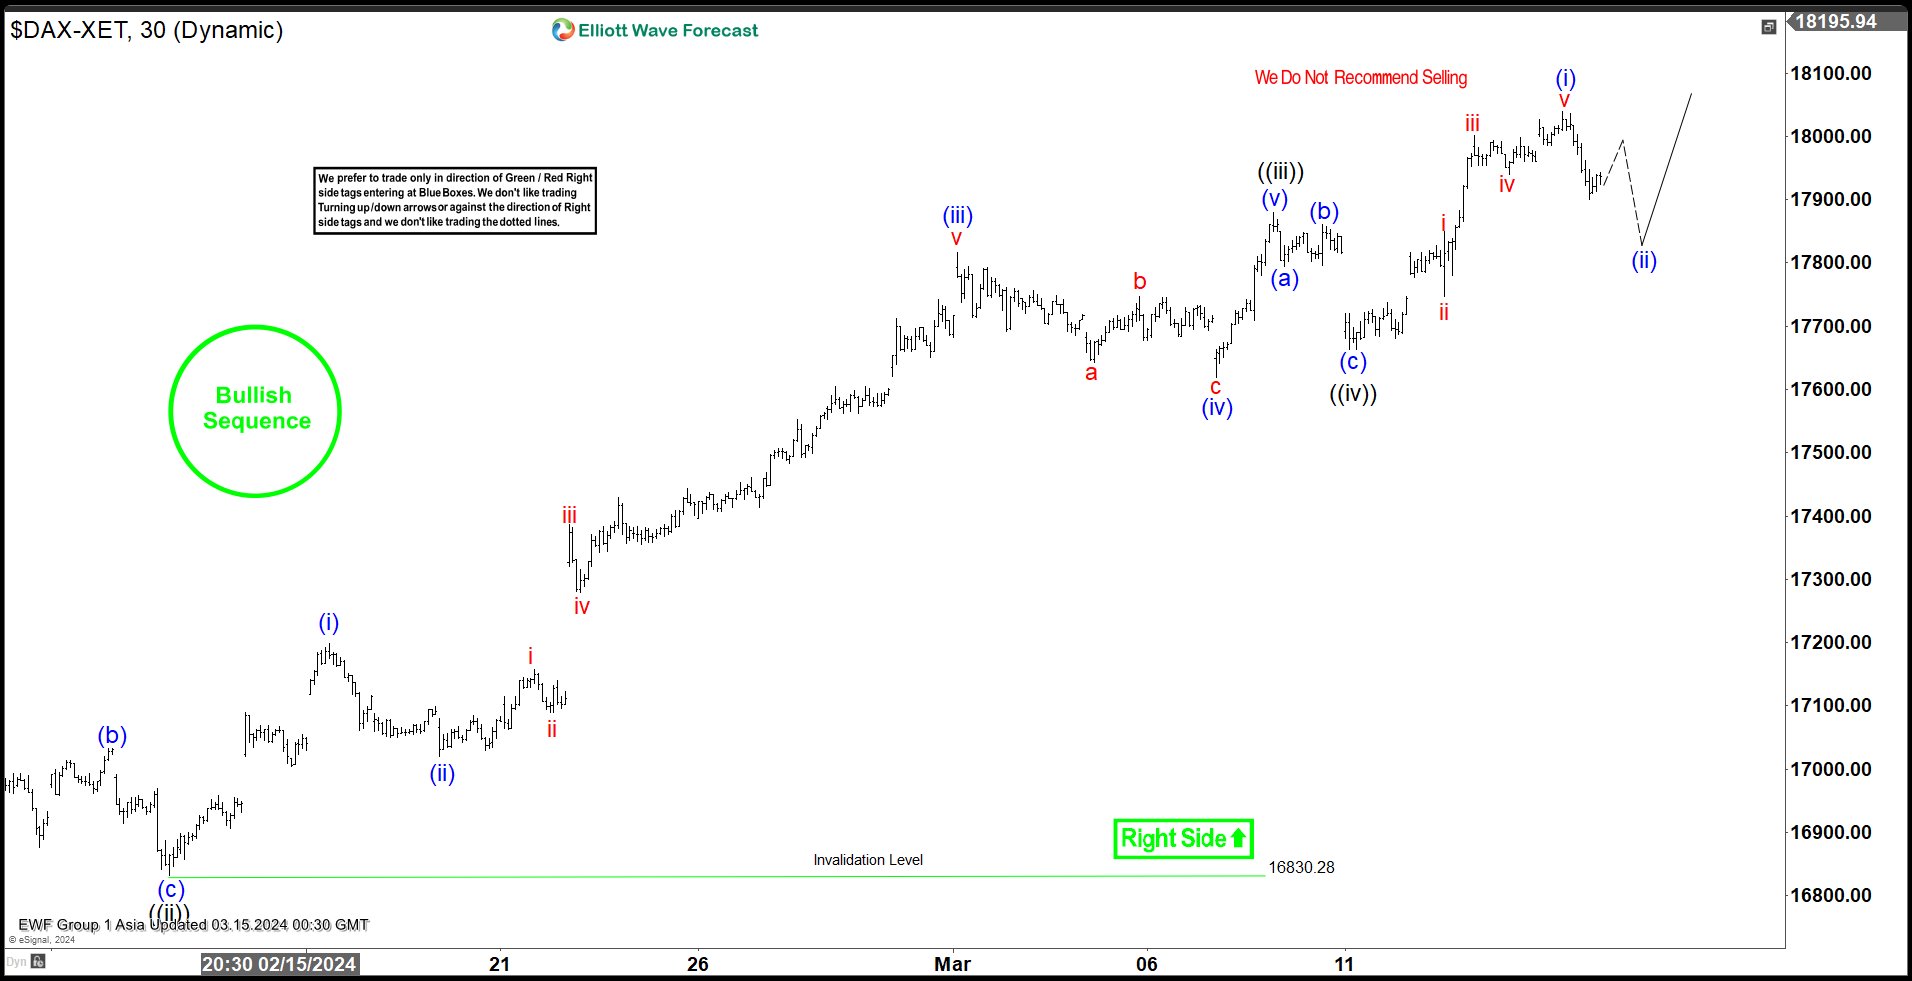
Short Term Elliott Wave view in DAX suggests cycle from 1.17.2024 low is in progress as a 5 waves impulse. Up from 1.17.2024 low, wave ((i)) ended at 17049.52 and pullback in wave ((ii)) ended at 16830.28 as the 30 minutes chart below shows. The Index then rallies higher within in wave ((iii)) with internal subdivision as another impulse in lesser degree. Up from wave ((ii)), wave (i) ended at 17198.45 and pullback in wave (ii) ended at 17019.15. The Index extended higher in wave (iii) towards 17816.52 and pullback in wave (iv) ended at 17619.4. The Index extended higher again in wave (v) towards 17879.11 which completed wave ((iii)) in higher degree.
Pullback in wave ((iv)) subdivided into a zigzag structure. Down from wave ((iii)), wave (a) ended at 17795.13 and wave (b) ended at 17860.51. Wave (c) lower ended at 17662.55 which completed wave ((iv)). The Index has extended higher in wave ((v)) with internal subdivision as 5 waves impulse. Up from wave ((iv)), wave i ended at 17849.8 and wave ii ended at 17746.89. Index extended higher in wave iii towards 18001.42 and wave iv ended at 17939.50. Final leg wave v ended at 18039.05 which completed wave (i). Expect wave (ii) pullback to find support in 3, 7, or 11 swing for further upside, as far as pivot at 16830.28 low stays intact.
DAX 30 Minutes Elliott Wave Chart
DAX Elliott Wave Video


By loading the video, you agree to YouTube’s privacy policy.
Learn more


)%20ended%20at%2017049.52%20and%20pullback%20in%20wave%20((ii))%20ended%20at%2016830.28%20as%20the%2030%20minutes%20chart%20below%20shows.%20The%20Index%20then%20rallies%20higher%20within%20in%20wave%20((iii))%20with%20internal%20subdivision%20as%20another%20impulse%20in%20lesser%20degree.%20Up%20from%20wave%20((ii)),%20wave%20(i)%20ended%20at%2017198.45%20and%20pullback%20in%20wave%20(ii)%20ended%20at%2017019.15.%20The%20Index%20extended%20higher%20in%20wave%20(iii)%20towards%2017816.52%20and%20pullback%20in%20wave%20(iv)%20ended%20at%2017619.4.%20The%20Index%20extended%20higher%20again%20in%20wave%20(v)%20towards%2017879.11%20which%20completed%20wave%20((iii))%20in%20higher%20degree.)