
- Gold creates bearish triangle after bullish rally
- MACD and RSI look weak
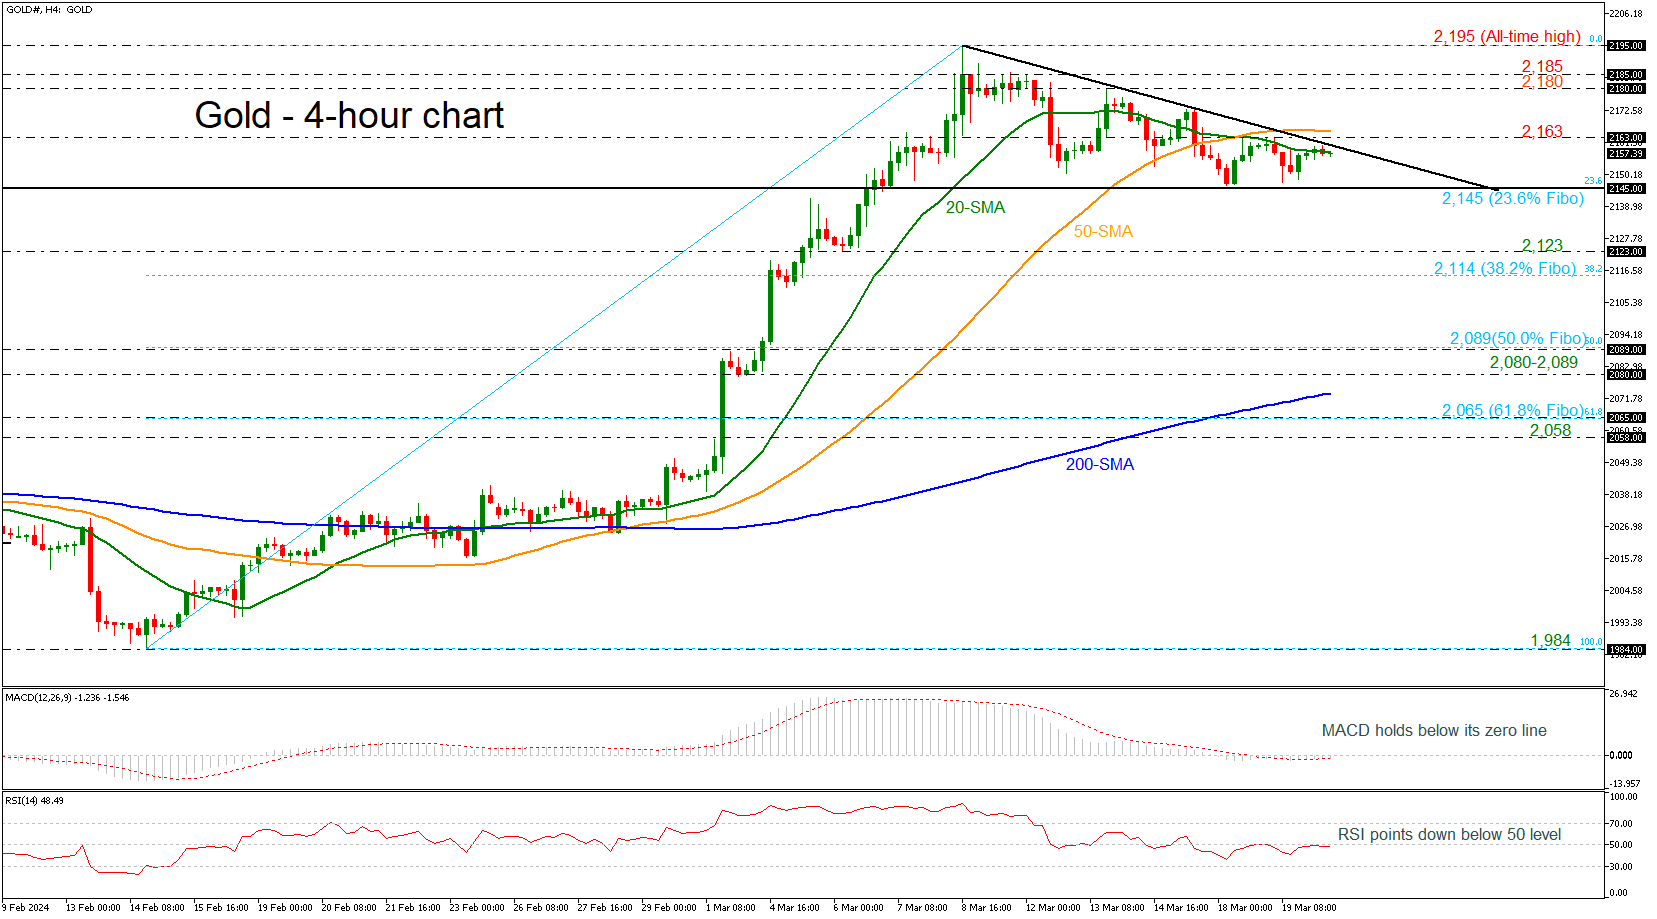
Gold prices have been developing within a descending triangle in the 4-hour chart, after the rally towards the new all-time high of 2,195 on March 8. The price is posting a bearish correction with the technical oscillators indicating weak momentum. The MACD is moving horizontally beneath the zero level, while the RSI is pointing down below the 50 level.
If resistance at 2,163 stands firm though, the precious metal could plummet again towards the 23.6% Fibonacci retracement level of the up leg from 1,984 to 2,195 at 2,145. The 2,123 support might tackle selling pressures, ahead of the 38.2% Fibonacci of 2,114. Then, if the bears breach the 2,100 psychological mark, the bearish wave might pick up pace towards the 50.0% Fibonacci of 2,089.
In the positive scenario, where gold jumps above its 20 and 50-period simple moving averages (SMAs) and the near-term descending trend line, traders might pay attention to the 2,180-2,185 restrictive region. A bounce higher could take a breather around the record peak of 2,195.
All in all, despite the negative mood in the market, broader outlook leaves the door open to another upturn. A rebound above 2,163 could renew buying appetite.


