
- USDCAD switches back to gains, surpasses SMAs
- Technical signals cannot warrant a bullish channel breakout
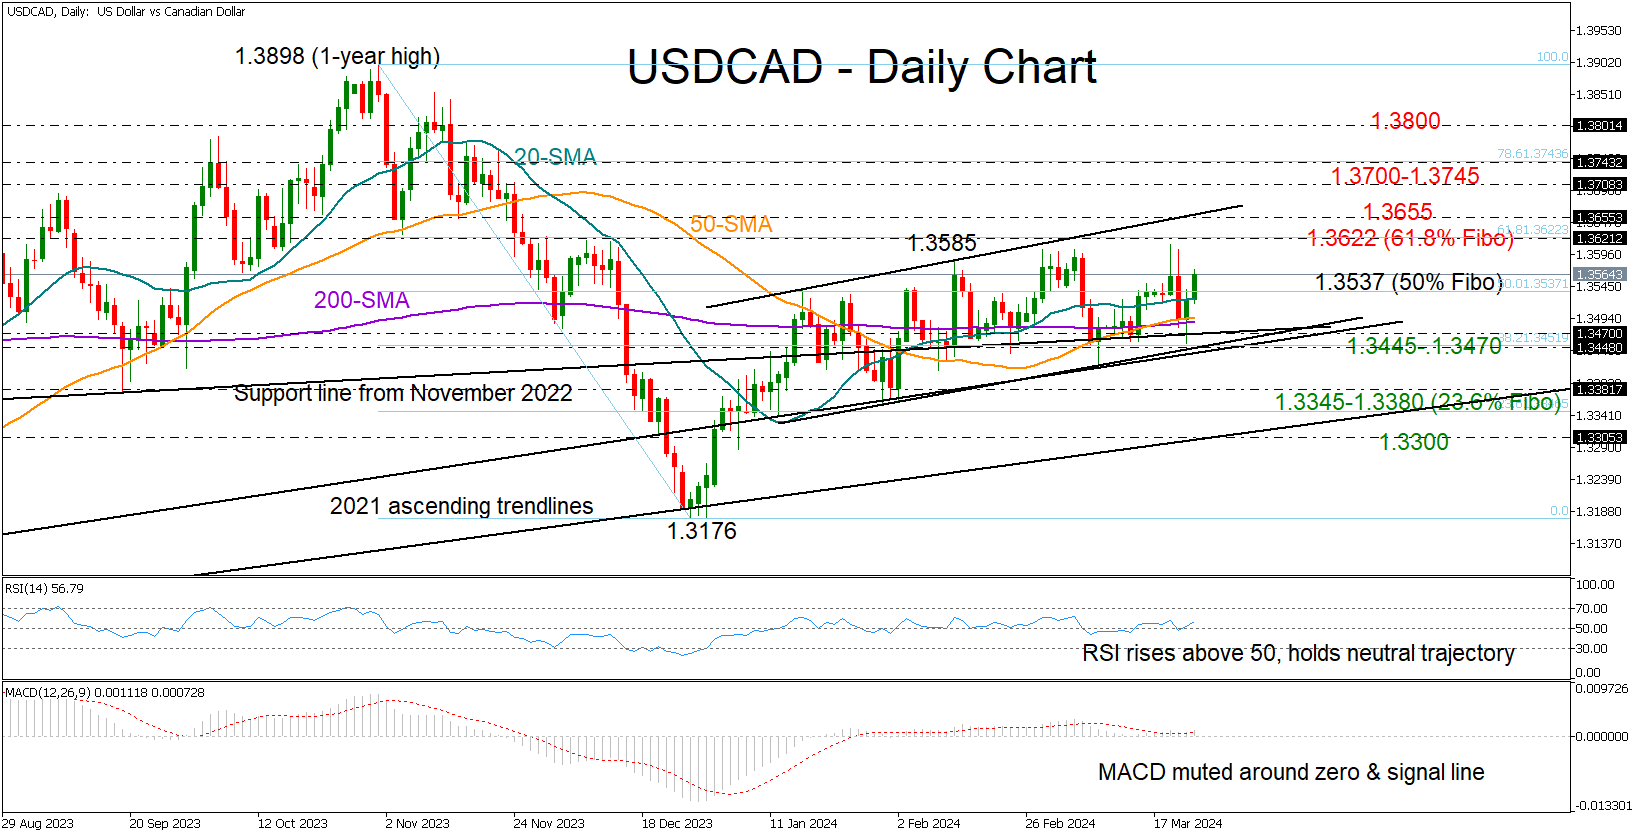
USDCAD successfully recovered from a flash drop to 1.3454 and closed Thursday’s session above the 50- and 200-day SMAs, maintaining its position within the short-term bullish channel. Consequently, the bulls piled in on Friday to drive the pair above the 20-day SMA and the 50% Fibonacci retracement of the November-December downtrend, which has been a key resistance zone since the start of the year.
The recent bullish accomplishments have raised expectations for further progress towards the upper boundary of the channel at 1.3655. However, the current neutral trend in the RSI and MACD does not inspire confidence. Prior to a channel breakout, the bulls will have to overcome the 61.8% Fibonacci mark of 1.3622. Should they exit the channel on the upside, resistance could initially develop somewhere within the 1.3700-1.3745 region, and then around 1.3800.
Conversely, if the pair sinks below the important 1.3445-1.3470 support area, it could seek shelter within the 1.3345-1.3380 territory, where the 23.6% Fibonacci number is placed. Even lower, the bears might push towards the ascending trendline, which connects the 2021 and 2022 lows at 1.3300.
Overall, the recent rise in USDCAD doesn’t provide enough technical evidence for an immediate extension towards the upper boundary of the channel.


