
Short Term Elliott Wave view in Gold (XAUUSD) suggests that Gold ended the cycle from 12.13.2023 low. Rally from 12.13.2023 low unfolded as an impulse. Up from there, wave ((i)) ended at 2088.48 and dips in wave ((ii)) ended at 1984.37. The metal then resumed higher in wave ((iii)) towards 2195.15 as the 1 hour chart below shows. Pullback in wave ((iv)) unfolded as a double three Elliott Wave structure. Down from wave ((iii)), wave (w) ended at 2150.45 and wave (x) ended at 2179.81. Wave (y) lower ended at 2145.70 which completed wave ((iv)).
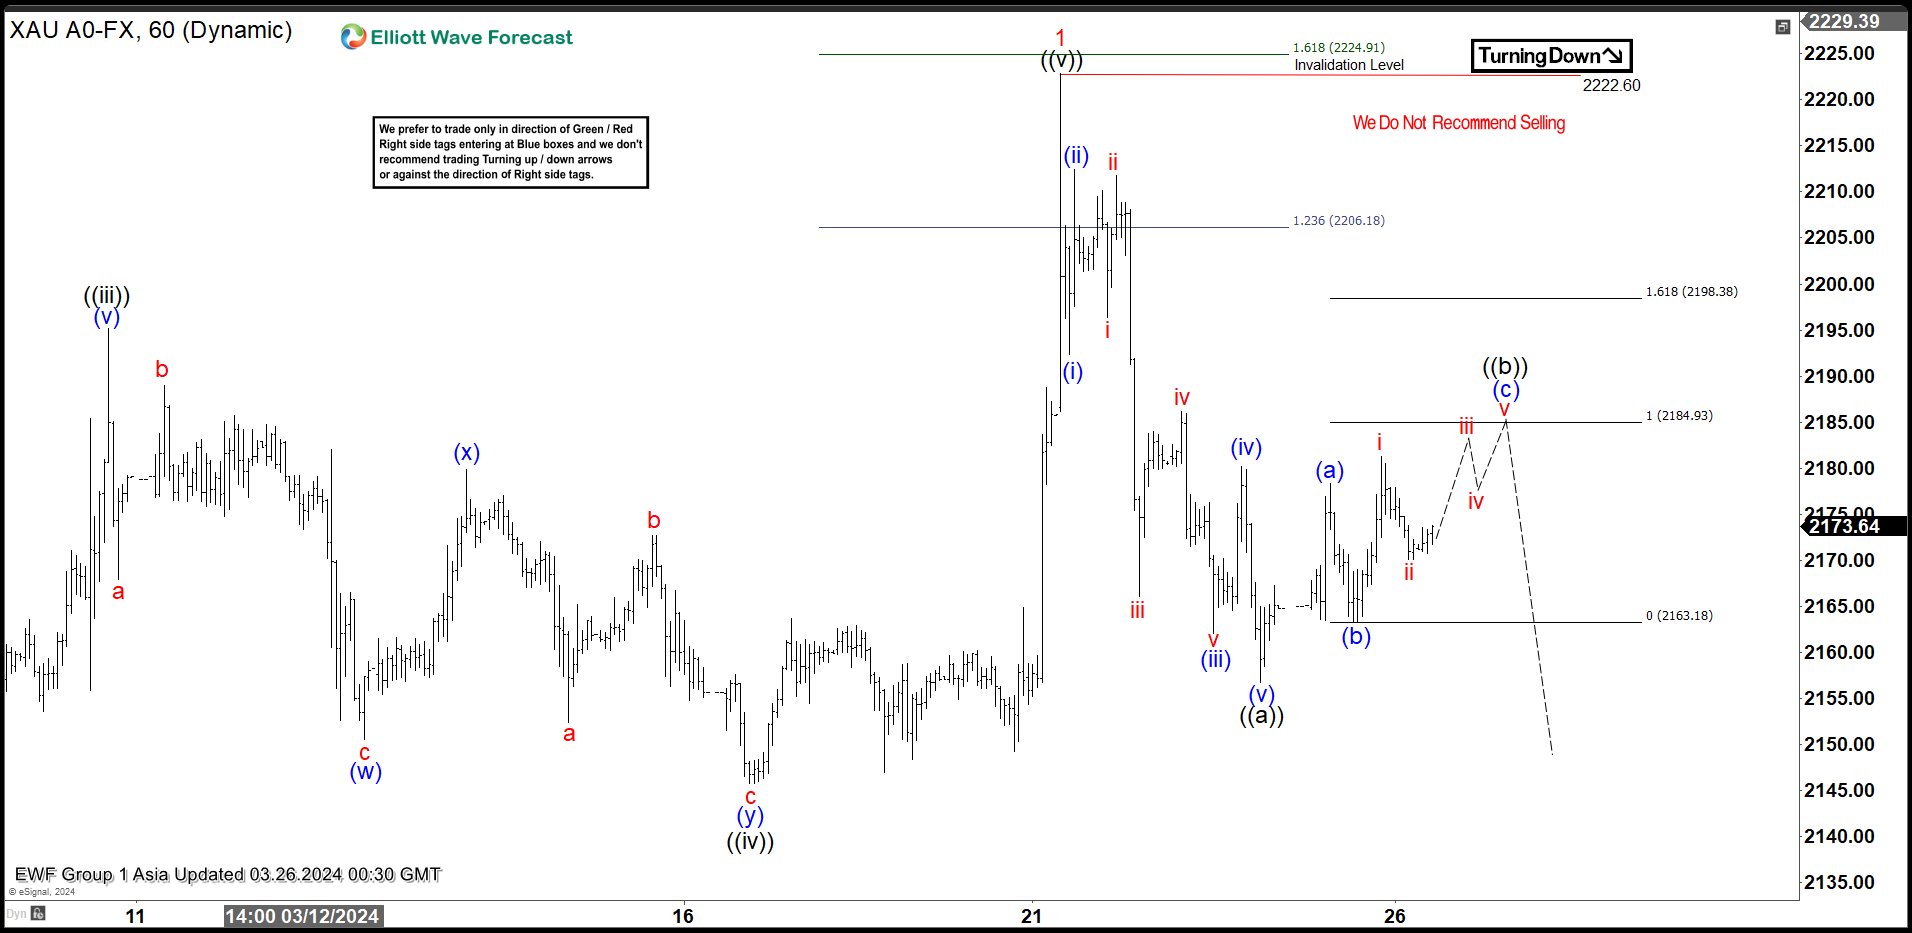
Final leg wave ((v)) ended at 2222.91 which completed wave 1 in higher degree. The metal is now in larger degree wave 2 pullback to correct cycle from 12.13.2023 low. The pullback unfolded as a zigzag Elliott Wave structure. Down from wave 1, wave (i) ended at 2192.3 and wave (ii) ended at 2212.45. Wave (iii) lower ended at 2162, wave (iv) ended at 2180.13, and wave (v) lower ended at 2156.7 which completed wave ((a)) in higher degree. Wave ((b)) unfolded as a zigzag structure. Up from wave ((a)), wave (a) ended at 2178.29 and wave (b) ended at 2163.2. Expect wave (c) of ((b)) to end at 2184.9 – 2198 before the metal turns lower. As far as pivot at 2222.92 high stays intact, expect rally to fail in 3, 7, 11 swing for further downside.
Gold (XAUUSD) 60 Minutes Elliott Wave Chart
XAUUSD Elliott Wave Video


By loading the video, you agree to YouTube’s privacy policy.
Learn more


%20suggests%20that%20Gold%20ended%20the%20cycle%20from%2012.13.2023%20low.%20Rally%20from%2012.13.2023%20low%20unfolded%20as%20an%20impulse.%20Up%20from%20there,%20wave%20((i))%20ended%20at%202088.48%20and%20dips%20in%20wave%20((ii))%20ended%20at%201984.37.%20The%20metal%20then%20resumed%20higher%20in%20wave%20((iii))%20towards%202195.15%20as%20the%201%20hour%20chart%20below%20shows.%20Pullback%20in%20wave%20((iv))%20unfolded%20as%20a%20double%20three%20Elliott%20Wave%20structure.%20Down%20from%20wave%20((iii)),%20wave%20(w)%20ended%20at%202150.45%20and%20wave%20(x)%20ended%20at%202179.81.%20Wave%20(y)%20lower%20ended%20at%202145.70%20which%20completed%20wave%20((iv)).)