
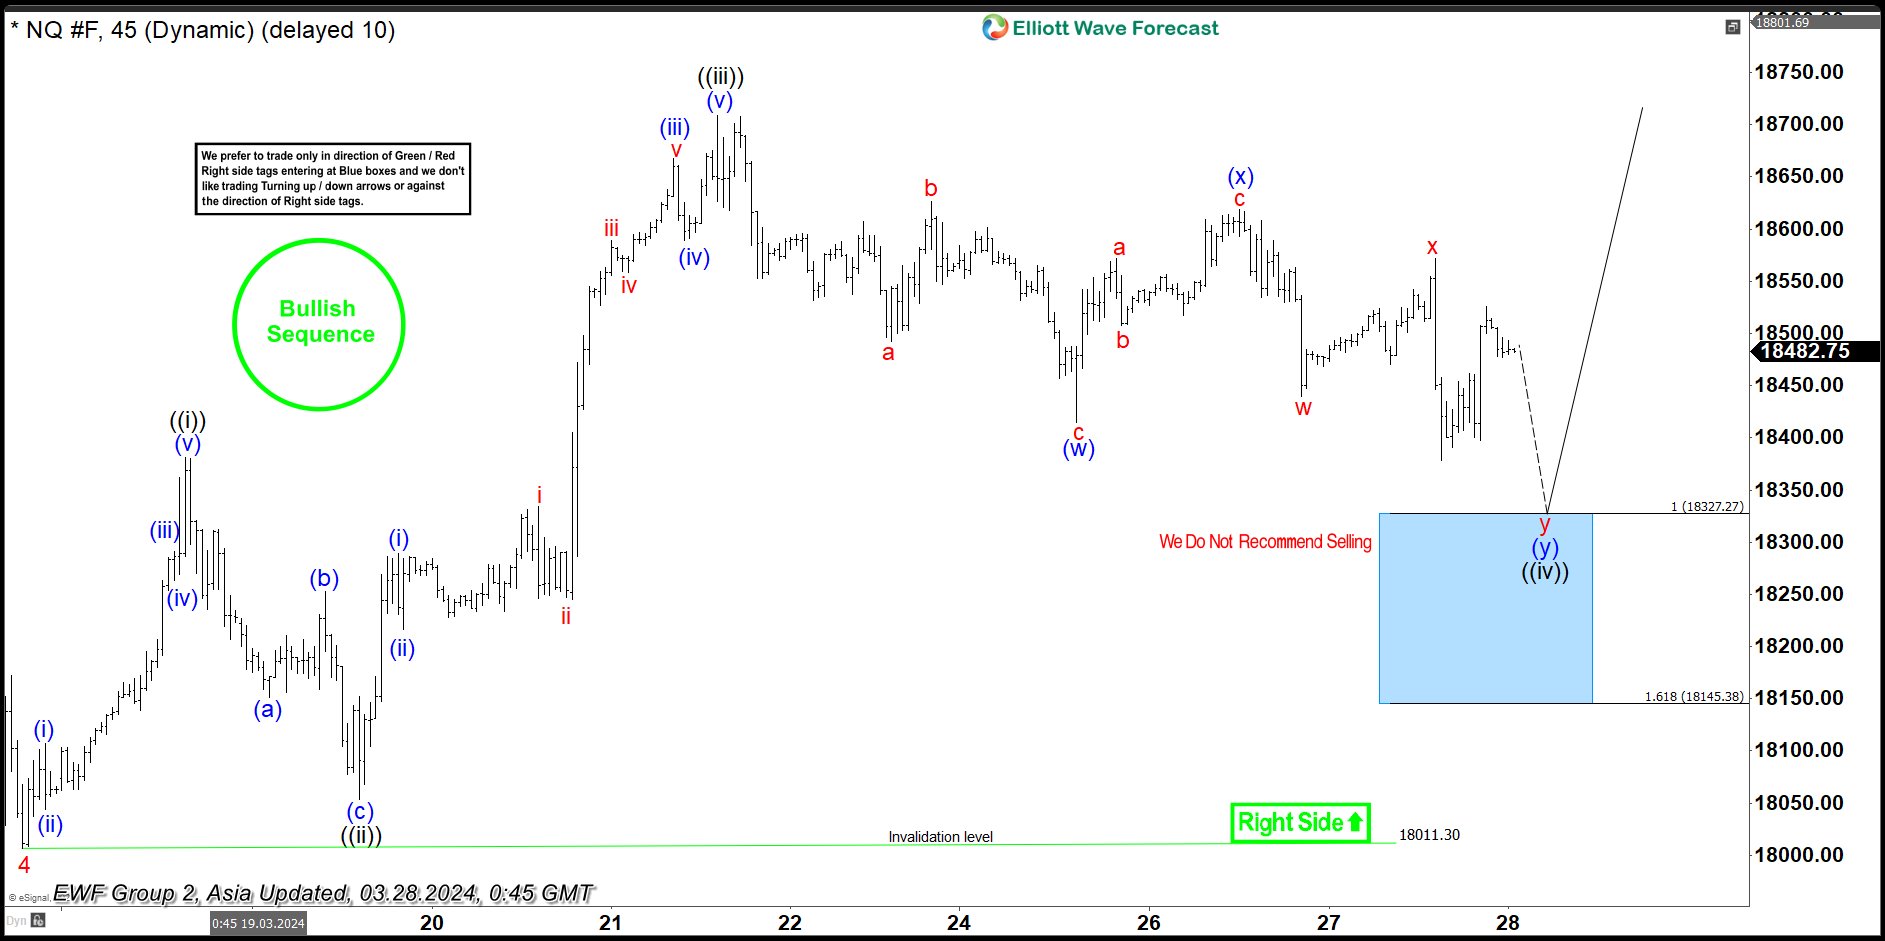
Short Term Elliott Wave view in Nasdaq 100 (NQ) suggests that pullback to 18011.3 ended wave 4. The Index has turned higher in wave 5. Internal subdivision of wave 5 is unfolding as a diagonal. Up from wave 4, wave (i) ended at 18106.75 and wave (ii) ended at 18044. Wave (iii) higher ended at 18289.25 and wave (iv) ended at 18263.25. Final leg wave (v) ended at 18381 which completed wave ((i)). Pullback in wave ((ii)) ended at 18053.25 as a zigzag. The Index then resumed higher in wave ((iii)). Up from wave ((ii)), wave (i) ended at 18289.25 and wave (ii) ended at 18216.5. Wave (iii) higher ended at 18667.25 and wave (iv) ended at 18589.25. Final leg wave (v) ended at 18709 which completed wave ((iii)) in higher degree.
Wave ((iv)) pullback is in progress with internal subdivision as a double three. Down from wave ((iii)), wave a ended at 18492, wave b ended at 18626, and wave c lower ended at 18414.75. This completed wave (w) in higher degree. Rally in wave (x) ended at 18619 as a zigzag structure. Down from wave (x), wave w ended at 18439.25, and wave x ended at 18571.75. Expect the Index to extend lower in wave y to 18145 -18327 (blue box area) to complete wave (y) of ((iv)). From this area, the Index should resume higher or rally in 3 waves at least.
NQ 45 Minutes Elliott Wave Chart
Nasdaq 100 (NQ) Elliott Wave Video


By loading the video, you agree to YouTube’s privacy policy.
Learn more


 Favors Upside")


%20suggests%20that%20pullback%20to%2018011.3%20ended%20wave%204.%20The%20Index%20has%20turned%20higher%20in%20wave%205.%20Internal%20subdivision%20of%20wave%205%20is%20unfolding%20as%20a%20diagonal.%20Up%20from%20wave%204,%20wave%20(i)%20ended%20at%2018106.75%20and%20wave%20(ii)%20ended%20at%2018044.%20Wave%20(iii)%20higher%20ended%20at%2018289.25%20and%20wave%20(iv)%20ended%20at%2018263.25.%20Final%20leg%20wave%20(v)%20ended%20at%2018381%20which%20completed%20wave%20((i)).%20Pullback%20in%20wave%20((ii))%20ended%20at%2018053.25%20as%20a%20zigzag.%20The%20Index%20then%20resumed%20higher%20in%20wave%20((iii)).%20Up%20from%20wave%20((ii)),%20wave%20(i)%20ended%20at%2018289.25%20and%20wave%20(ii)%20ended%20at%2018216.5.%20Wave%20(iii)%20higher%20ended%20at%2018667.25%20and%20wave%20(iv)%20ended%20at%2018589.25.%20Final%20leg%20wave%20(v)%20ended%20at%2018709%20which%20completed%20wave%20((iii))%20in%20higher%20degree.)