
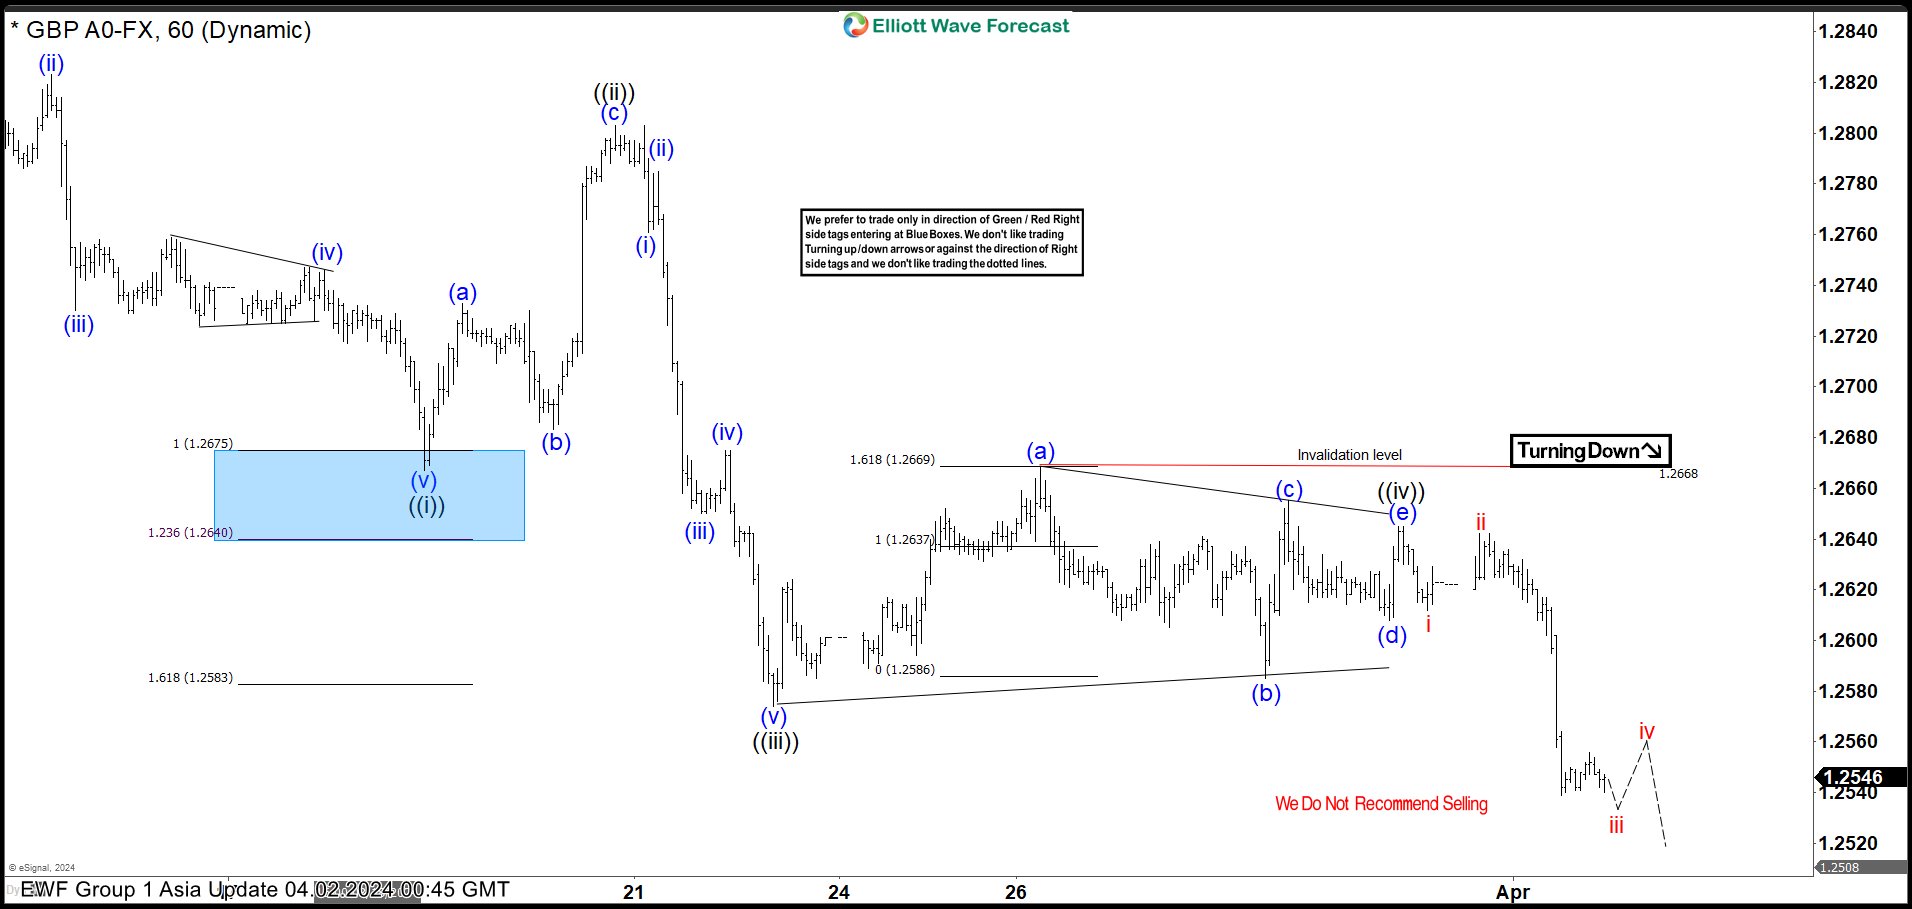
Short Term Elliott Wave view in GBPUSD suggests that decline from 3.8.2024 high is unfolding s an impulse Elliott Wave structure. Down from 3.8.2024 high, wave (i) ended at 1.2745 and wave (ii) rally ended at 1.2823. Wave (iii) lower ended at 1.273 and wave (iv) ended at 1.2747. Final leg wave (v) ended at 1.2667 which completed wave ((i)). From there, pair rallied as a zigzag. Wave (a) ended at 1.2733 and wave (b) ended at 1.268. Wave (c) higher ended at 1.28 which completed wave ((ii)). Pair then resumed lower in wave ((iii)).
Down from wave ((ii)), wave (i) ended at 1.276 and wave (ii) ended at 1.278. Wave (iii) lower ended at 1.265, wave (iv) ended at 1.267 and wave (v) ended at 1.257. This completed wave ((iii)) in higher degree. Wave ((iv)) unfolded as a triangle and ended at 1.2645. Pair resumed lower afterwards. Down from wave ((iv)), wave i ended at 1.261 and wave ii ended at 1.264. Expect pair to extend two more lows to end wave (i) of ((v)). As far as pivot at 1.267 high stays intact, expect rally to fail in 3, 7, 11 swing for further downside.
GBPUSD 60 Minutes Elliott Wave Chart
GBPUSD Elliott Wave Video


By loading the video, you agree to YouTube’s privacy policy.
Learn more


%20ended%20at%201.2745%20and%20wave%20(ii)%20rally%20ended%20at%201.2823.%20Wave%20(iii)%20lower%20ended%20at%201.273%20and%20wave%20(iv)%20ended%20at%201.2747.%20Final%20leg%20wave%20(v)%20ended%20at%201.2667%20which%20completed%20wave%20((i)).%20From%20there,%20pair%20rallied%20as%20a%20zigzag.%20Wave%20(a)%20ended%20at%201.2733%20and%20wave%20(b)%20ended%20at%201.268.%20Wave%20(c)%20higher%20ended%20at%201.28%20which%20completed%20wave%20((ii)).%20Pair%20then%20resumed%20lower%20in%20wave%20((iii)).)