
- GBPUSD drops below uptrend line
- Price remains within sideways channel
- MACD and RSI indicate neutral-to-bearish bias
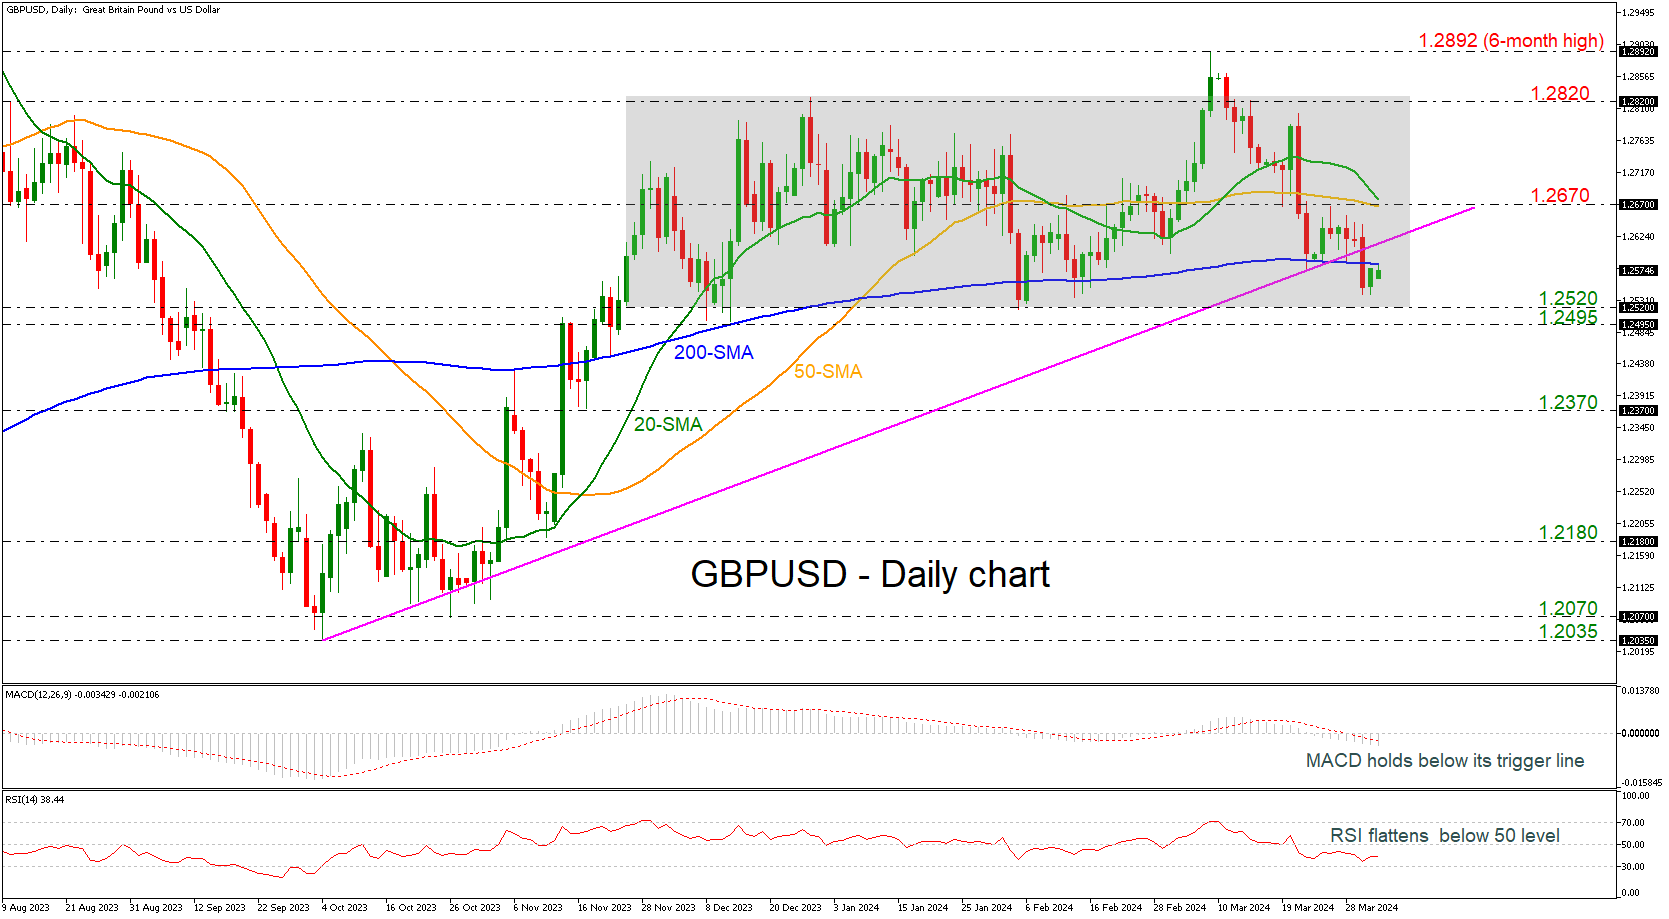
GBPUSD dropped beneath the long-term ascending trend line and the 200-day simple moving average (SMA. Nevertheless, it has not escaped the consolidation area of 1.2520-1.2820, which has confined the price action since November 24. Currently, the pair is trying to recoup some of the previous days’ losses, but the momentum is still weak.
In case of a sell-off beneath the lower boundary of the range and the 1.2495 support line, the market outlook will switch to a more negative one, challenging the 1.2370 barricade.
The technical oscillators are confirming the neutral-to-bearish outlook as the MACD is extending its negative movement beneath its trigger and zero lines, while the RSI is moving horizontally beneath the neutral threshold of 50.
In the positive scenario, a successful jump above the 200-day SMA could open the way for a retest of the mid-level of the channel at 1.2670, which overlaps with the upcoming bearish crossover within the 20- and the 50-day SMAs. Even higher, the upper boundary of the range at 1.2820 may halt upside pressure.
To sum up, GBPUSD lacks a clear direction in the medium-term timeframe and a bearish tendency in the longer timeframe cannot be not excluded.


