
Hello fellow traders. In this technical blog we’re going to take a quick look at the Elliott Wave charts of AUDJPY Forex pair, published in members area of the website. As our members know we have been favoring the long side in YEN pairs. Recently we got a pull back that has made a clear 3 waves pull back that found buyers right at the equal legs area. In the further text we are going to explain the Elliott Wave forecast
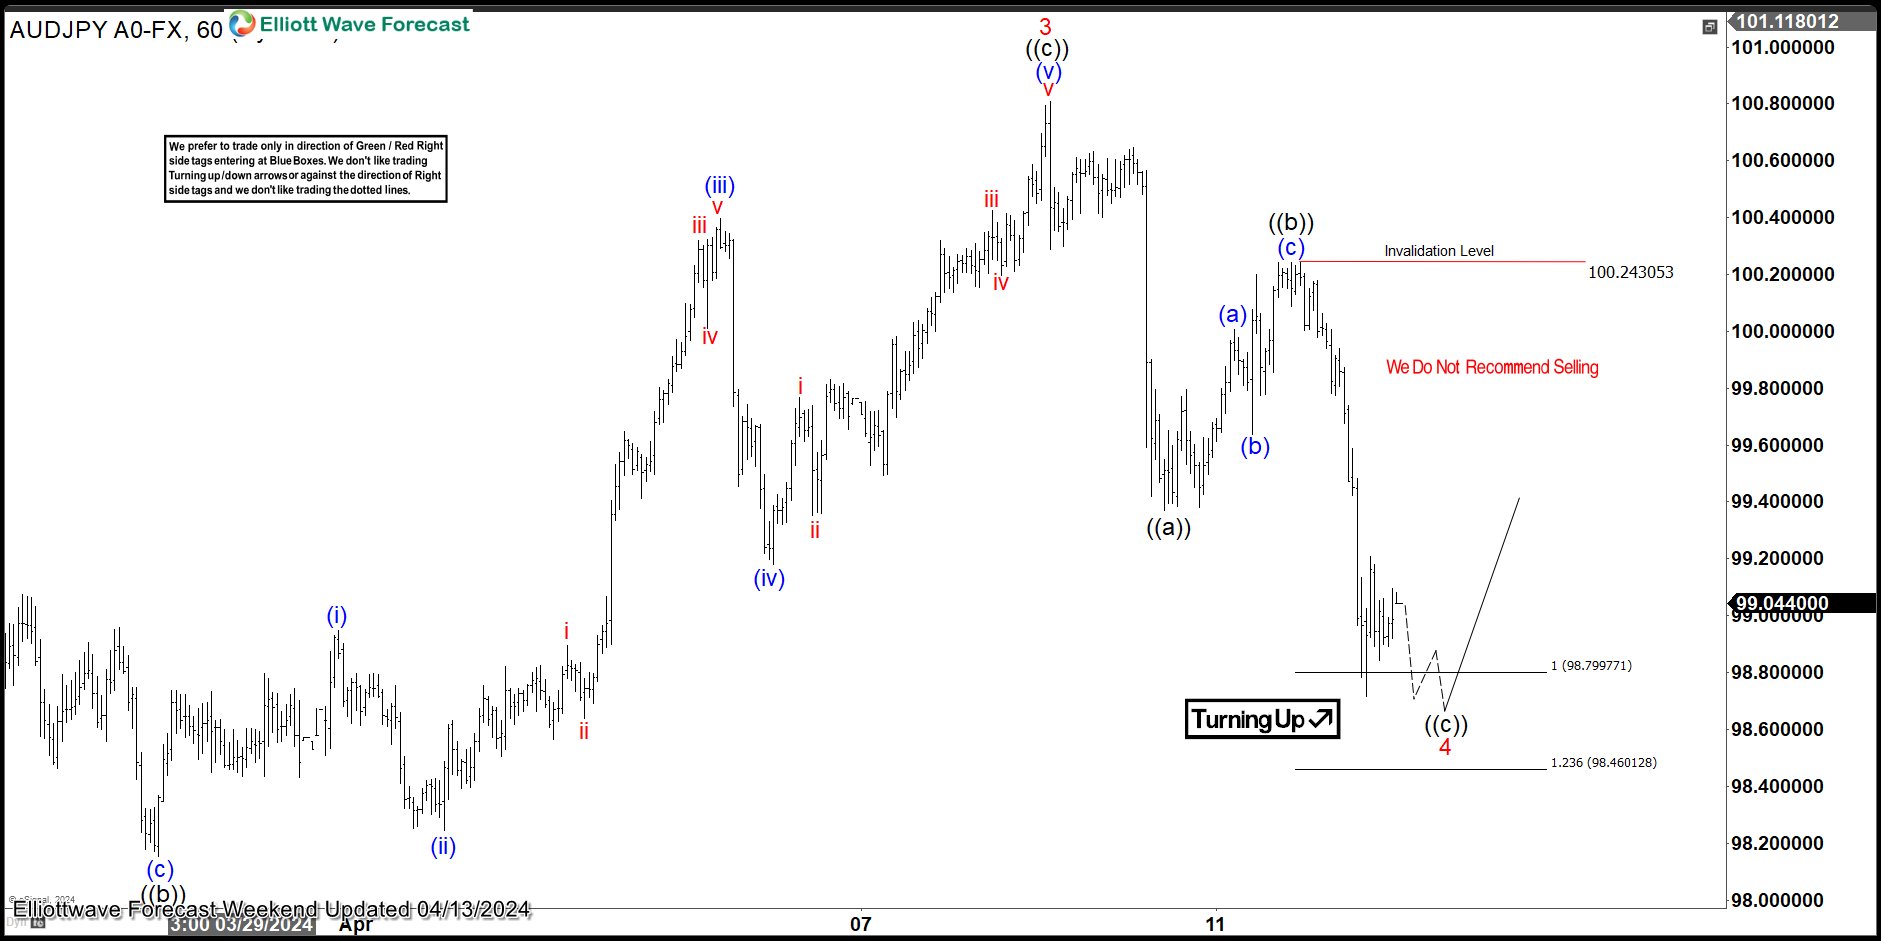
AUDJPY H1 Weekend Update 04.13.2024
AUDJPY ended cycle from the 96.8676 low and now correcting it. Current view suggests wave 4 red pull back can be unfolding as Elliott Wave Zig Zag Pattern. The Equal legs area is already reached at 98.799-98.460. We are aware that pull back can complete any moment. We don’t recommend selling the pair and expect further rally to resume from the buyers zone : 98.799-98.460.
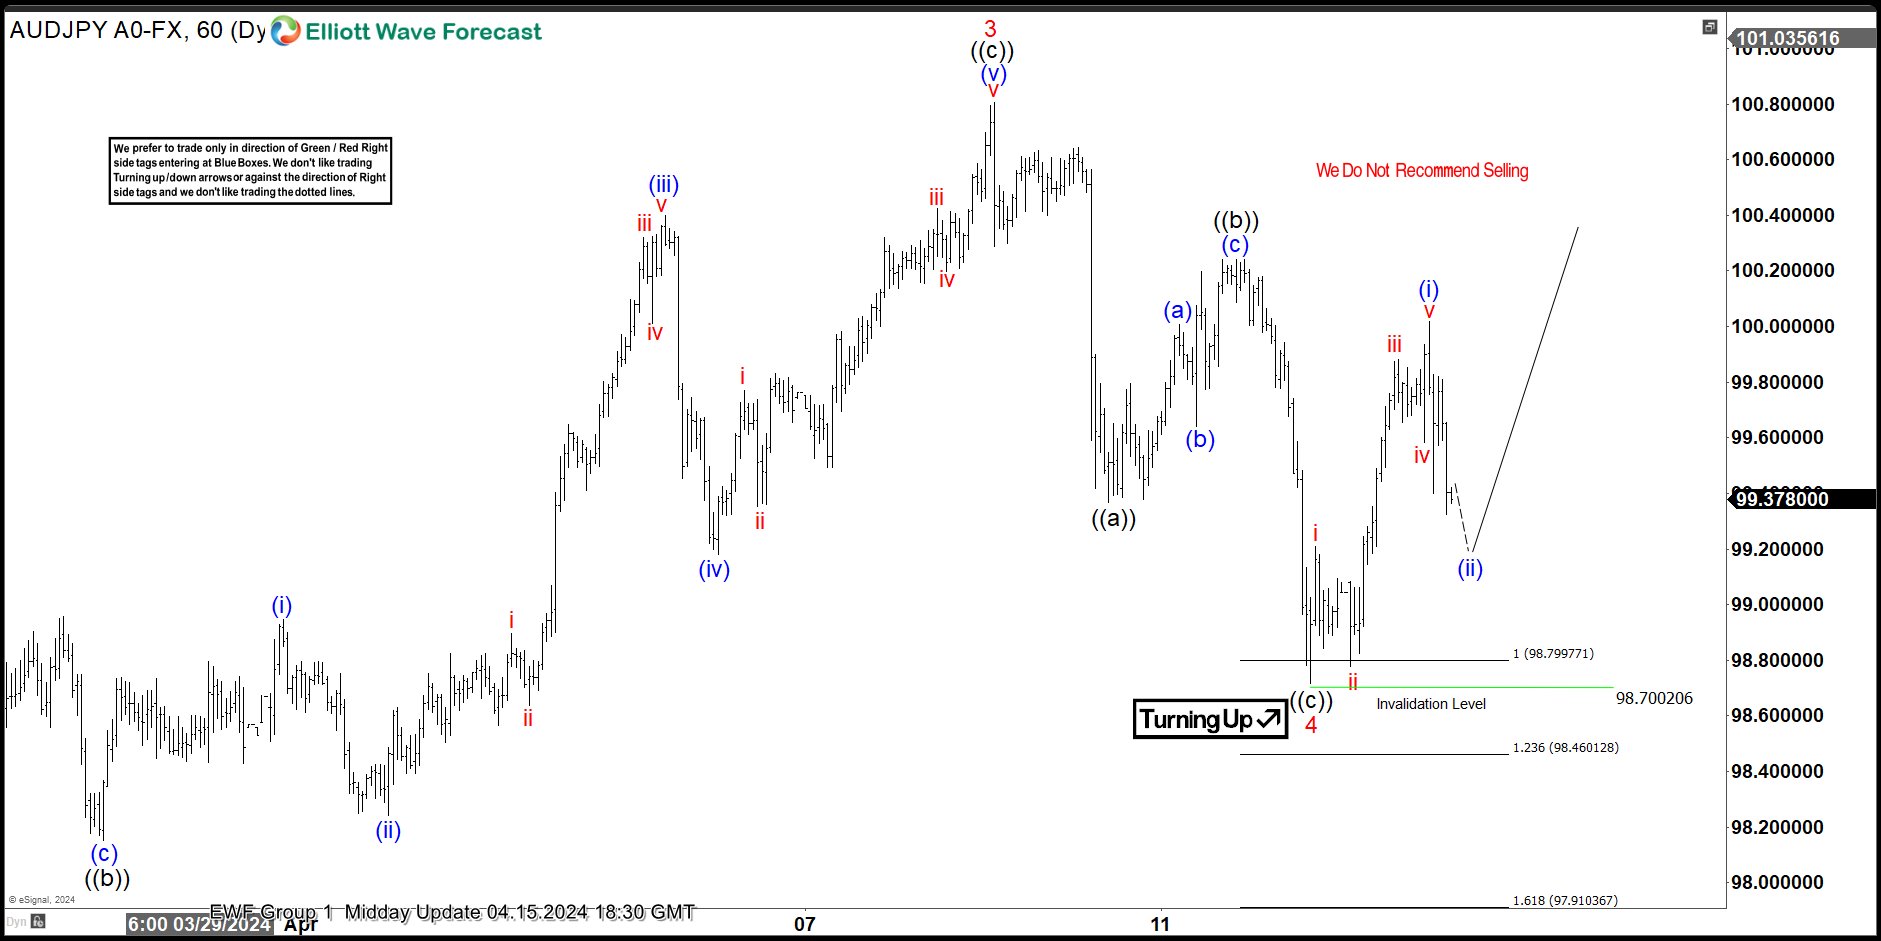
AUDJPY H1 Weekend Update 04.15.2024
AUDJPY has given us a nice reaction from the Equal Legs zone as expected. The bounce reached and exceeded 50% Fibonacci retracement against the ((b)) high, so we consider wave 4 red completed at the 98.7 low. We anticipate a break of the 3 red peak to confirm that the next leg up is in progress. Alternatively, if the price breaks below the 98.7 low, the pair will open up the possibility for a 7-swing pattern toward 97.963-97.476 area. In that case, any long positions will be stopped out at Break Even, and we will look to buy the dips again at the next set of equal legs.


