
- GBPUSD rebounds strongly from a 5-month bottom
- But meets strong resistance at 200-day SMA
- Momentum indicators improve but remain neutral-to-negative
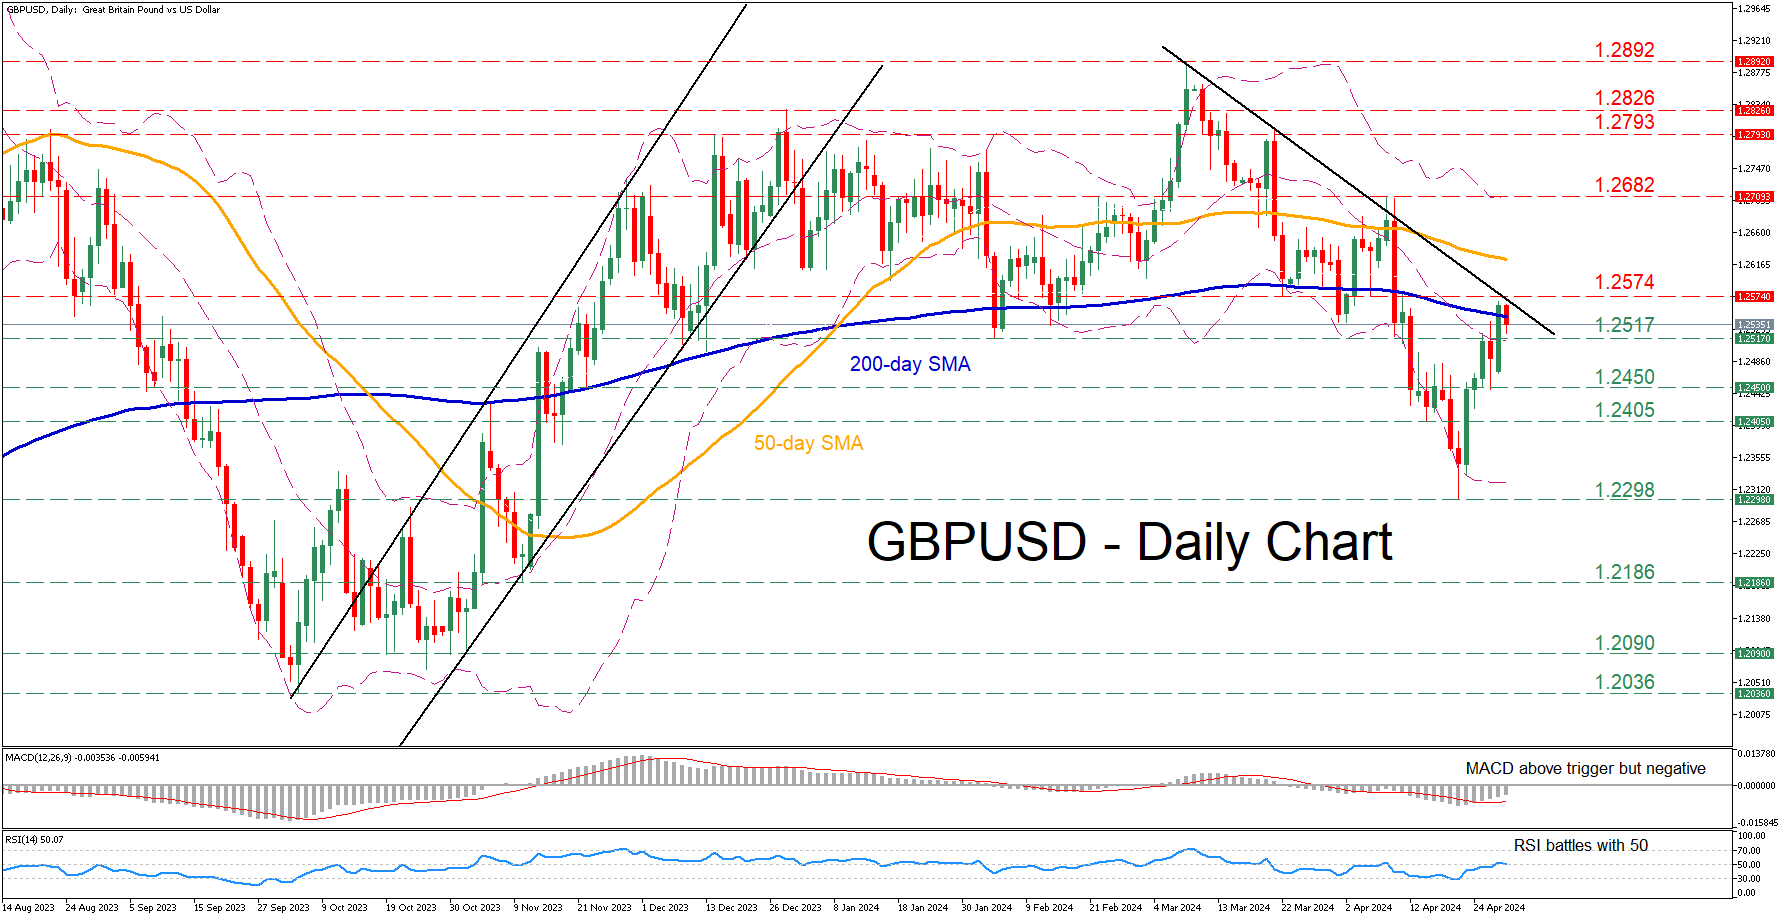
GBPUSD experienced a vast decline after posting a fresh 2024 high of 1.2892, generating a clear structure of lower highs and lower lows. Although the pair has been attempting a recovery in the past few sessions following its bounce off a fresh five-month bottom, the 200-day simple moving average (SMA) appears to be curbing its upside.
Should bullish pressures persist, the pair might test the March-April support of 1.2574, which could now serve as resistance. A break above that zone could pave the way for the April peak of 1.2682. Higher, the December resistance of 1.2793 could prove to be the next barricade for the bulls to overcome.
Alternatively, a downside move could meet initial support at the February bottom of 1.2517. Sliding beneath that region, the price may retreat towards 1.2450 ahead of the April support of 1.2405. Further declines could then cease at the five-month bottom of 1.2298.
In brief, GBPUSD has been attempting to recoup some losses after falling to its lowest level since November 2023. For the rebound to extend though, the pair needs to initially jump above the 200-day SMA.


%20appears%20to%20be%20curbing%20its%20upside.)