
- Nasdaq 100 has exhibited short-term intraday wild gyrations of 3% to 4% in opposite directions since last week.
- Today’s data focus will be on US non-farm payrolls and ISM Services PMI for April to offer clues on whether the stagflation risk narrative is still alive.
- Macro factors such as the movement of the US 10-year Treasury yield are likely to take over the driver’s seat over micro factors (earnings results) in the next two weeks.
- Key levels on the US 10-year Treasury yield to watch are 4.70% (above, likely to be bearish for Nasdaq 100) and 4.58% (below, bullish bias for Nasdaq 100).
Since our last publication, the Nasdaq 100 has continued to inch lower from its current all-time high level of 18,465 printed on 21 March 2024. It has just ended April with a monthly loss of -4.46%, its worst monthly performance since September 2023 after its prior five consecutive months of positive returns.
So far it has recorded a maximum drawdown of -8% from its current all-time high to the recent 19 April 2024 low of 16,974, and current episodes of minor rebounds in price actions have been rejected by the downward slopping 20 and 50-day moving averages; the hallmark of a potential on-going medium-term corrective decline sequence within its longer-term major uptrend phase.
On a shorter-term intraday basis, wild gyrations between a range of 3% to 4% in opposite directions have been seen on the Nasdaq 100 due to several significant risk events, and data releases that unfolded this week, two of the “Magnificent 7 group of mega-cap US stocks earnings results (Amazon and Apple), US ISM Manufacturing PMI, US Treasury refunding requirements, and the FOMC monetary policy meeting.
These events and data sets offered conflicting signals on the state of the US economy; stagflation risk is still alive but negated by the Fed’s upcoming Quantitative Tightening (QT) taper initiative to kickstart in June where the monthly amount of US Treasuries roll-off in the Fed’s balance sheet will be reduced to US$25 billion from US$60 billion.
Hence, the QT taper initiative has offered a relief to potentially cap any adverse liquidity squeeze in the US financial system that can trigger a spike in short-term and overnight interest rates as a lesser amount of banks’ reverses may be needed to fund the US Treasury general account (TGA) as the amount in the Fed’s overnight reverse repos facility (the primary source of funding for TGA replenishment since September 2023) has dwindled to almost zero (US$428.68 billion as of 2 May 2024) from a peak of US$2.55 trillion in December 2022.
Watch US NFP & ISM Services PMI for more clarity on the state of the US economy
There will be two more key pieces of economic data to digest before we end this hectic and volatile week, US non-farm payrolls for April where there may be a risk of upside surprise as consensus expectations have been lowballed to +181K jobs added after a surprise rosy print of +232K jobs in March. April’s ISM Services PMI on the health of the US services sector will be out later; still in an expansionary mode (above 50 reading) but the pace of expansion has slowed since the start of the year with last month’s March print of 51.1 versus 53.4 seen in January. If April’s number comes in below expectations of 52 and March’s 51.1, the stagflation risk narrative is likely to gain traction again.
US 10-year Treasury yield may dictate Nasdaq 100’s next intermediate moves
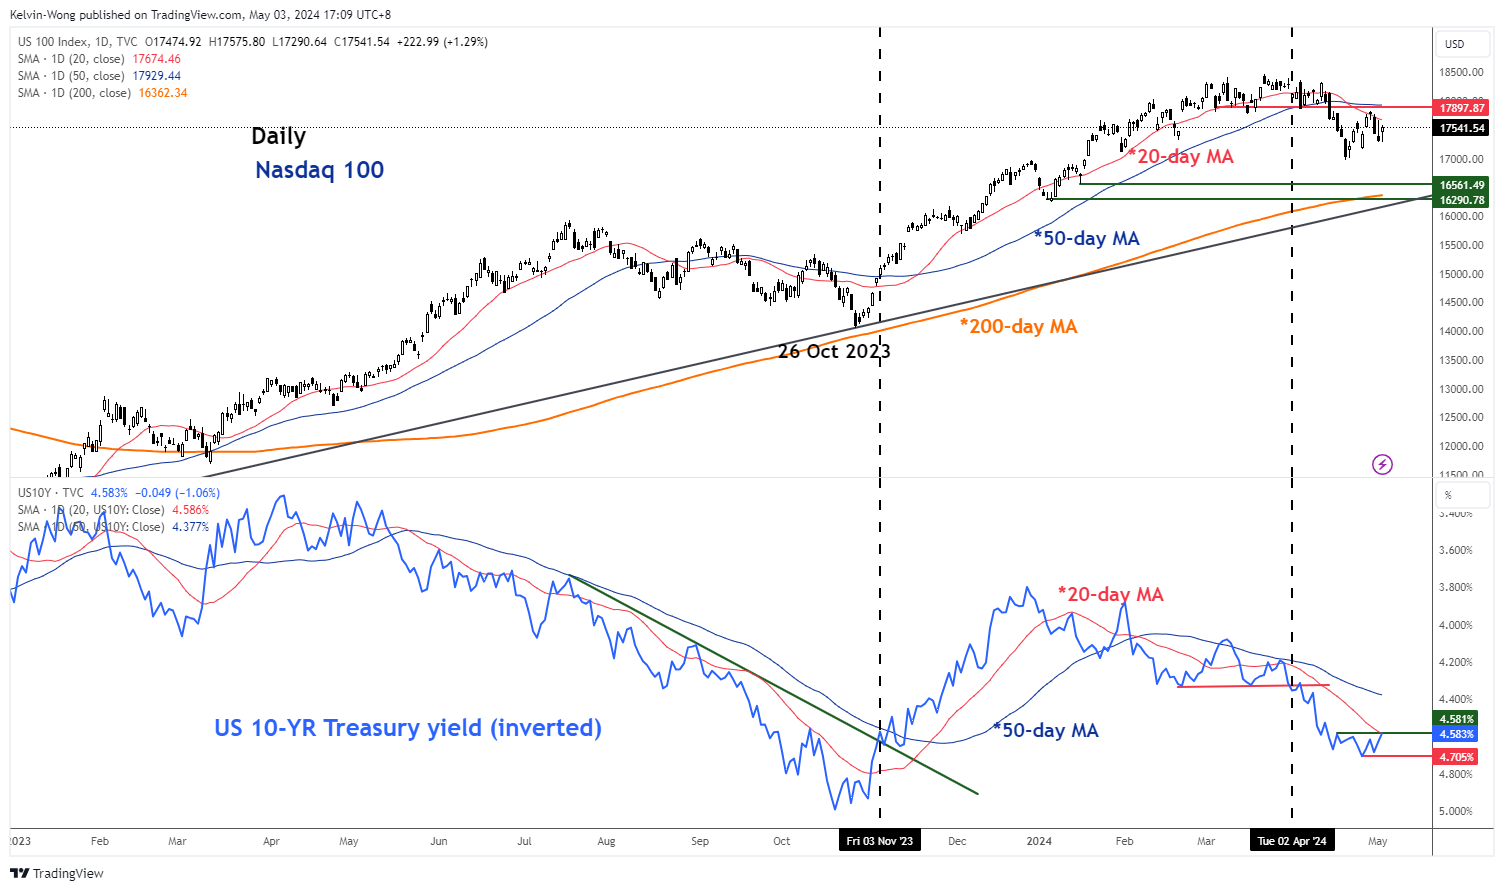
Fig 1: Nasdaq 100 & US 10-YR Treasury yield (inverted) medium-term trends as of 2 May 2024 (Source: TradingView, click to enlarge chart)
Considering macro intermarket analysis, the movement on the US 10-year Treasury yield does have a significant spill-over impact on the major US stock indices on the short to medium-term time horizon via the long-term cost of funding conduit. A persistent uptrend in the US 10-year Treasury yield (considered as a long-term risk-free rate) will lead to a step-up increase in interest rates charged on corporate loans which may put downside pressure on net profit margins (lowering earnings growth potential), and vice versa for a downtrend US 10-year Treasury yield.
Interestingly, yesterday’s rally on the US stock indices; S&P 500 (+0.91%), Nasdaq 100 (+1.29%), Dow Jones Industrial Average (+0.85%), and Russell 2000 (+1.81%) has been accompanied by a dip of 5 basis points in the US 10-year Treasury yield to 4.58%, its lowest level seen in almost two weeks.
The kick-start of the prior medium-term uptrend of the Nasdaq 100 from its 28 October 2023 swing low has been supported by a breakdown of the US 10-year Treasury yield (inverted) parallel support of 4.62% on 3 November 2023.
The recent -8% corrective decline sequence of the Nasdaq 100 from its 21 March 2024 current all-time to 19 April 2024 low has been reinforced by a breakout of the 4.32% resistance on the US 10-year Treasury yield (inverted) on 2 April 2024 (see Fig 1).
Hence, amid the choppy movements of the Nasdaq 100 seen this week, do take a closer look at the movement of the US 10-year Treasury yield as a key macro factor that might influence the movement of the Nasdaq 100 in the next two weeks while key micro factors (earnings results) have taken a backseat for now until the earnings release of Nvidia on 22 May.
A clearance above 4.70% resistance on the US 10-year Treasury yield (inverted) may trigger another potential downleg in the Nasdaq 100 with its key medium-term support zone coming in at 16,560/290 (also the 200-day moving average).
On the flip side, a break below 4.58% near-term support on the US 10-year Treasury yield (inverted) is likely to see a continuation of the rebound on the Nasdaq 100 from the19 April 2024 low to expose the next intermediate resistance at 17,900 (also the 50-day moving average).


