
Key Highlights
- Bitcoin price recovered above $63,500 but faced resistance at $65,500.
- BTC cleared a key bearish trend line at $63,250 on the 4-hour chart.
- Crude oil prices extended losses and declined below $78.80.
- Gold might struggle to start a fresh increase above $2,335.
Bitcoin Price Technical Analysis
Bitcoin price formed a base and started a fresh increase above $60,000. BTC/USD was able to clear the $61,500 and $62,500 resistance levels.
Looking at the 4-hour chart, the price cleared a key bearish trend line at $63,250. It even surpassed the $64,200 level and the 100 simple moving average (red, 4 hours). However, the bears were active near the $65,500 resistance and the 200 simple moving average (green, 4 hours).
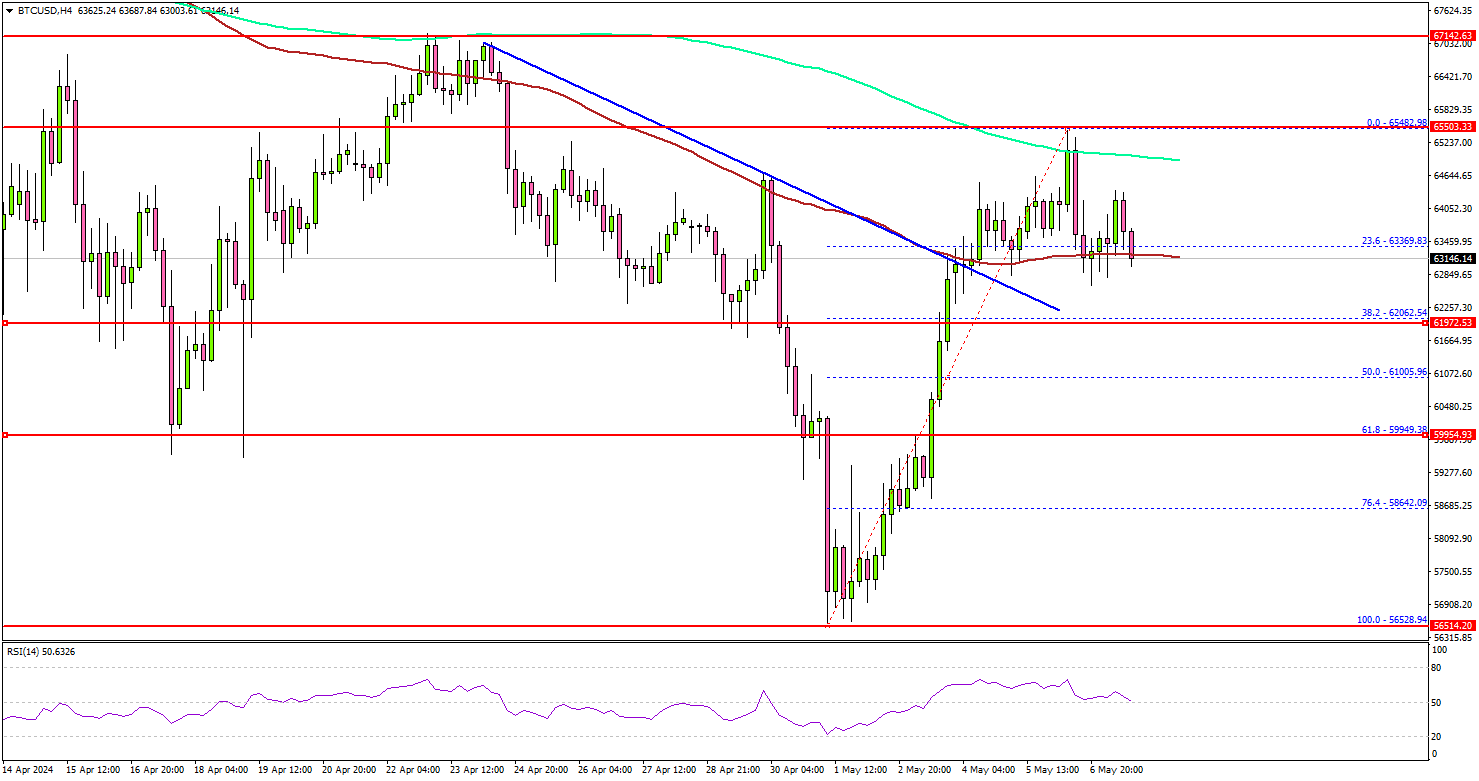
A high was formed at $65,482 and the price corrected gains. It retested the 100 simple moving average (red, 4 hours). Immediate support is near the $62,000 level.
The next major support sits at $60,000 or the 61.8% Fib retracement level of the upward move from the $56,528 swing low to the $65,482 high. Any more losses might send the price toward the $58,000 support zone.
Immediate resistance is near the $64,600 level. The first key resistance is near the $65,250 zone and the 200 simple moving average (green, 4 hours).
The next resistance is near $65,500. A successful close above $65,500 might start another steady increase. In the stated case, the price may perhaps rise toward the $68,000 level.
Economic Releases
- US Wholesale Inventories for March 2024 – Forecast -0.4%, versus -0.4% previous.
- Fed’s Jefferson speech.


