
Short Term Elliott Wave in Gold (XAUUSD) suggests the rally from 5.03.2024 low ended a wave 3 at 2450.10 high. Wave 4 pullback is currently in progress. The internal subdivision of wave 4 takes the form of a double three Elliott Wave structure. Down from wave 3, wave (a) ended at 2407.15 low and wave (b) bounce ended at 2433.90. The stock extended lower in wave (c) towards 2325.20 which completed wave ((w)) in higher degree.
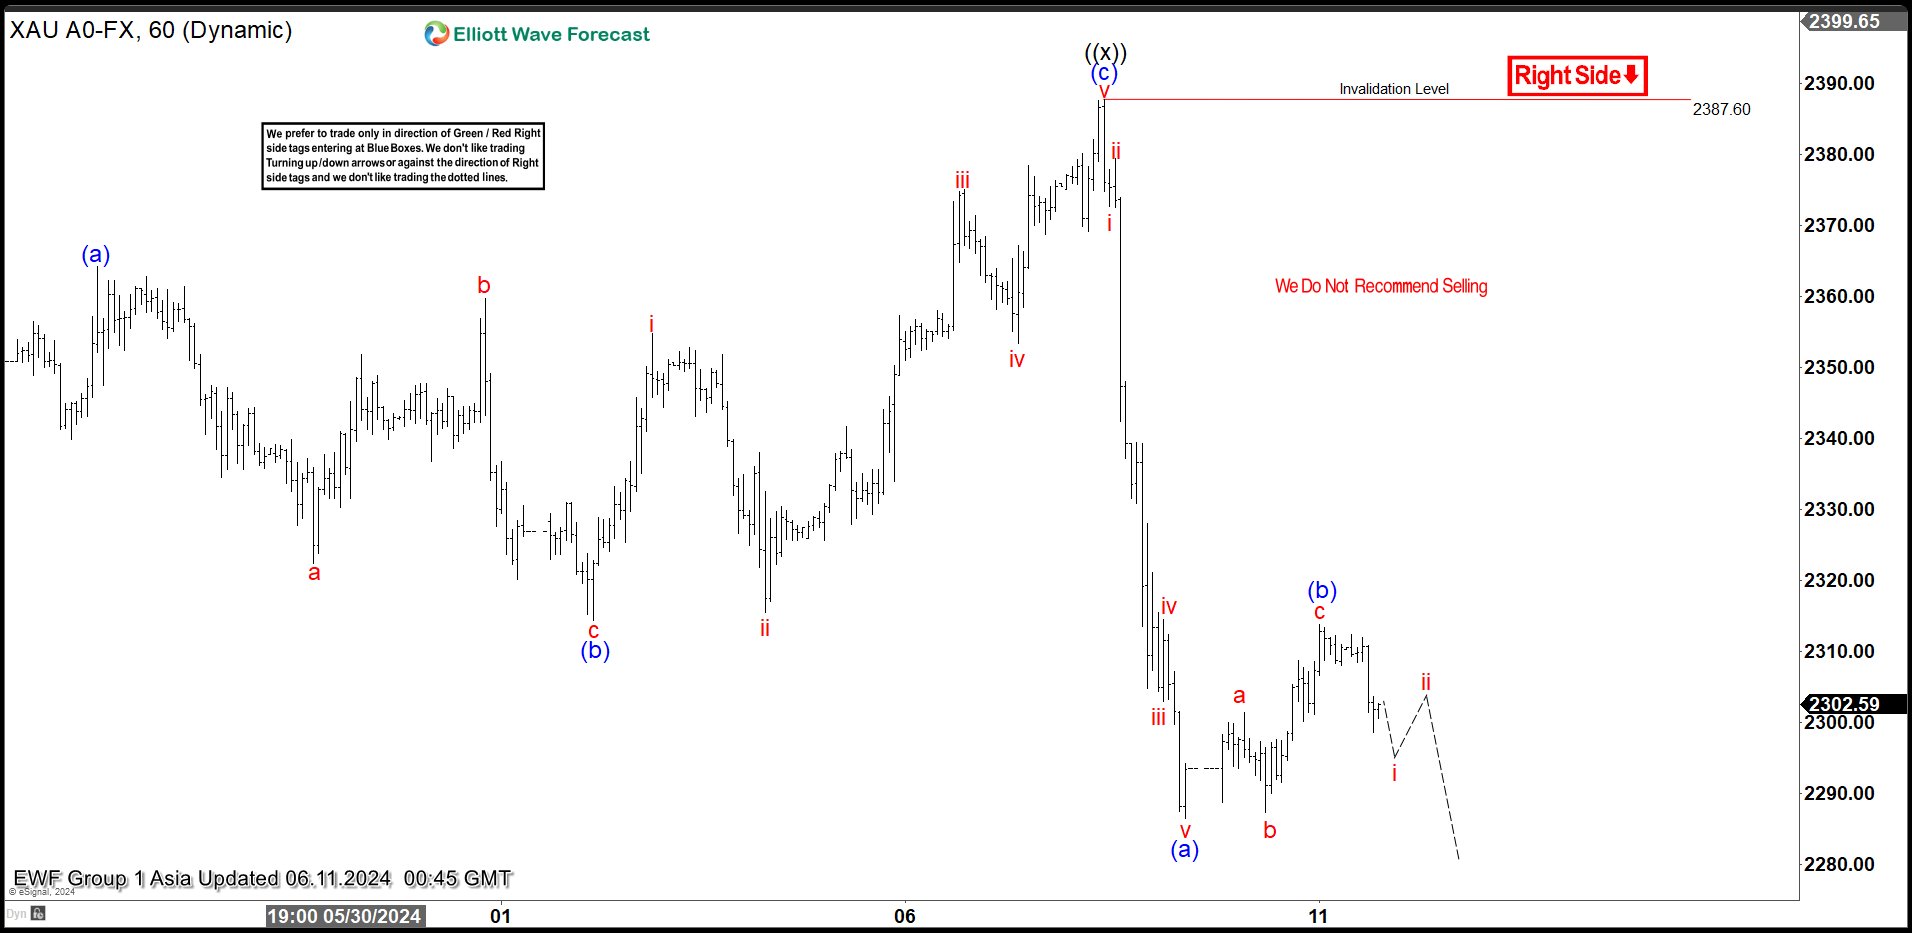
The market rallied starting wave ((x)) taking the form expanded flat structure. Up from wave ((w)), wave (a) ended at 2364.12 and pullback in wave (b) ended at 2314.40. Wave (c) higher finish at 2387.71 which completed wave ((x)). XAUUSD continued lower strongly in wave ((y)) of 4. Down from wave ((x)) Wave (a) of ((y)) ended at 2286.50 as an impulsive structure. Wave (b) bounce could already end at 2313.8 and the metal has turned lower in wave (c). Near term, while below 2387, it should continue lower in wave (c) of ((y)) to the extreme 100% – 161.8% Fibonacci area of wave ((a)). This area comes at 2262 – 2185 area where buyers should be waiting to continue the rally or see 3 swings higher at least.
XAUUSD 60 Minutes Elliott Wave Chart
XAUUSD Elliott Wave Video


By loading the video, you agree to YouTube’s privacy policy.
Learn more


 Price Smashes Through $2700/oz – Further Gains Ahead?")


%20suggests%20the%20rally%20from%205.03.2024%20low%20ended%20a%20wave%203%20at%202450.10%20high.%20Wave%204%20pullback%20is%20currently%20in%20progress.%20The%20internal%20subdivision%20of%20wave%204%20takes%20the%20form%20of%20a%20double%20three%20Elliott%20Wave%20structure.%20Down%20from%20wave%203,%20wave%20(a)%20ended%20at%202407.15%20low%20and%20wave%20(b)%20bounce%20ended%20at%202433.90.%20The%20stock%20extended%20lower%20in%20wave%20(c)%20towards%202325.20%20which%20completed%20wave%20((w))%20in%20higher%20degree.)