
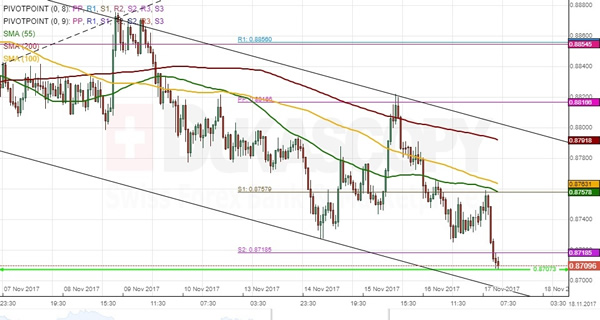
The pattern that has dominated the NZD/CAD currency pair for the last three months is a descending triangle. The rate was respecting the boundaries of this pattern for some time. However, this situation changed early in November when bulls failed to reach the upper boundary of this medium-term pattern. From this point forward, the pair has been stranded in a descending channel. Meanwhile, the Kiwi is testing the lower triangle boundary circa 0.87. It is likely that this level surrenders and allows for further decline down to the monthly S1 and the weekly S3 at 0.8670. The pair’s subsequent movement is expected to be north, as the rate should approach the upper line of either channel or triangle. Conversely, in case the 0.8660 mark is breached, the next support is the distant monthly S2 at 0.8514.


