
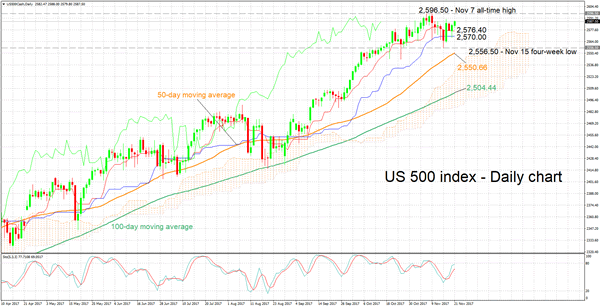
The US 500 index has been rising over the last two days and currently trades not far below the all-time high of 2,596.50 recorded on November 7.
The positive alignment with the Tenkan-sen line being above the Kijun-sen line is painting a bullish picture in the short-term. Notice though that both lines are flat at the moment. This could be an indication of positive momentum losing steam. The very-short term picture though remains positive as indicated by the stochastics: the %K line is above the slow %D line with both lines currently heading higher.
Should the index continue gaining, resistance might come around early November’s all-time high of 2,596.50 with the area around this level also encapsulating 2,600, a potential psychological mark.
On the downside, support might come around the current levels of the Tenkan- and Kijun-sen lines at 2,576.40 and 2,570.00 respectively. The area around these levels was also fairly congested recently. Further below, the range around November 15’s four-week low of 2,556.50 could provide additional support.
The medium-term picture is clearly bullish: the 50- and 100-day moving averages (MAs) are positively sloped with the price being above both MAs. In addition, the index is trading above the Ichimoku cloud.
Overall, both the short- and medium-term are currently looking bullish though it should be mentioned that there is a sign that positive short-term momentum might be losing steam.


