
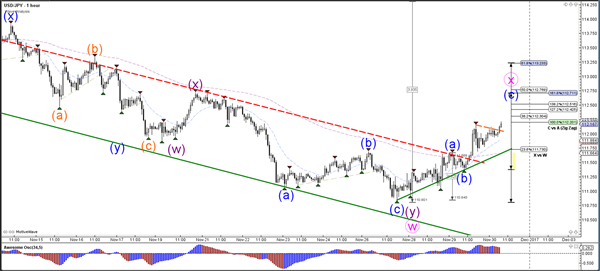
Currency pair USD/JPY
The USD/JPY broke above the resistance of the bearish channel (dotted red). The bullish breakout could indicate the completion of wave 2 or wave B (purple) as well. The key levels are the Fibs of wave X (pink) because a bearish bounce could see price fall towards the 61.8% at 110. Strong bullish momentum makes a wave X (pink) unlikely.

The USD/JPY broke above the resistance of the bearish channel (dotted red). The bullish breakout could indicate the completion of wave 2 or wave B (purple) as well. The key levels are the Fibs of wave X (pink) because a bearish bounce could see price fall towards the 61.8% at 110. Strong bullish momentum makes a wave X (pink) unlikely.

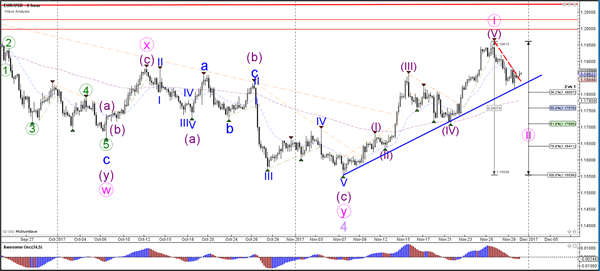
Currency pair EUR/USD
The EUR/USD bearish retracement has reached the support trend line (blue) which is a bullish bouncing spot. For the moment a larger wave 2 correction (pink) seems likely.
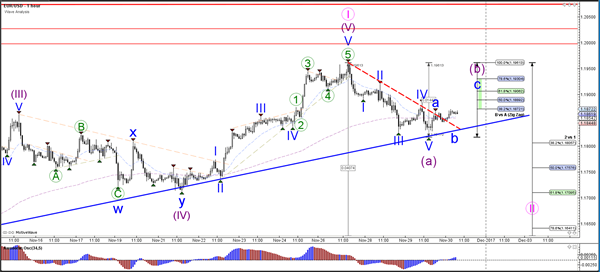
The EUR/USD completed 5 bearish waves (blue) which could be part of a larger wave A (purple). A bullish ABC (blue) could see price test the Fib levels of wave B (purple).

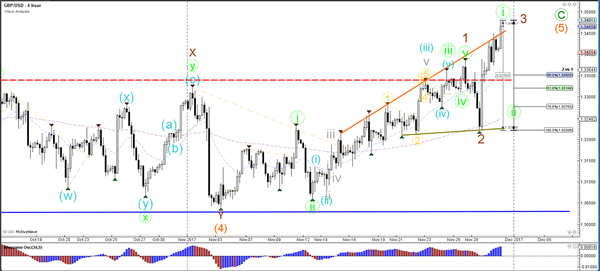
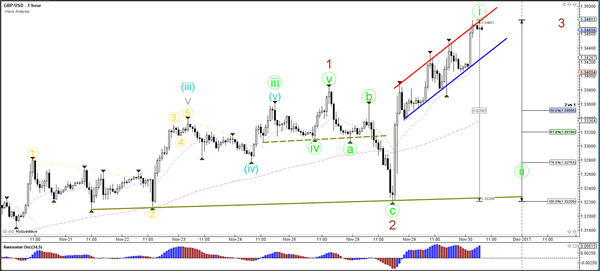
Currency pair GBP/USD
The second GBP/USD bullish breakout is showing strong momentum which could be part of a larger wave 5 (orange). The bullish price action is at a new bounce or break spot. A bearish bounce could see price retest the broken resistance (dotted red) and 50% Fibonacci of wave 2 vs 1.
The second GBP/USD bullish breakout is showing strong momentum which could be part of a larger wave 5 (orange). The bullish price action is at a new bounce or break spot. A bearish bounce could see price retest the broken resistance (dotted red) and 50% Fibonacci of wave 2 vs 1.


