
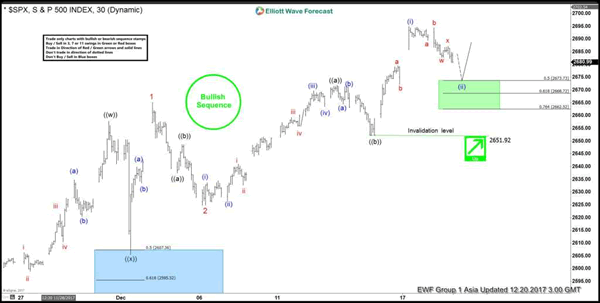
SPX Short term Elliott Wave view suggests that the rally to 2664.58 ended Minor wave 1 as a Leading diagonal. Below from there Minor wave 2 ended as a zigzag correction at 2625.22 low, above from there Minor wave 3 remains in progress as a zigzag structure and showing the incomplete bullish sequence to the upside. The Minute wave ((a)) ended in 5 waves at 2671.92 high, where internal Minutte wave (i) ended at 2633.72, Minutte wave (ii) ended at 2626.32 low, Minutte wave (iii) ended at 2669.68, Minutte wave (iv) ended at 2663.68 and Minutte wave (v) of ((a)) ended at 2671.92 peak.
Then it ended the Minute wave ((b)) pullback ended at 2651.92 low as a flat structure and above from there Minute wave ((c)) of 3 remain in progress. Where Minutte wave (i) of ((c)) ended at 2695.38 on 12/18 peak as a zigzag, below from there index is correcting 12/14 2651.92 lower cycle as a double correction in Minutte wave (ii) of ((c)) dip. And the area in between 2673.73-2662.52 50-76.4% Fibonacci retracement area is expected to end the correction against 12/14 cycle. Then as far as a pivot from 12/14 low stays intact index is expected to resume higher from 2673.73-2662.52 area or should do a 3 wave bounce at least. We don’t like selling the index and favor buying the Minutte wave (ii) dip from the Green box area for a 3 wave bounce at least.
SPX 1 Hour Elliott Wave Chart


