
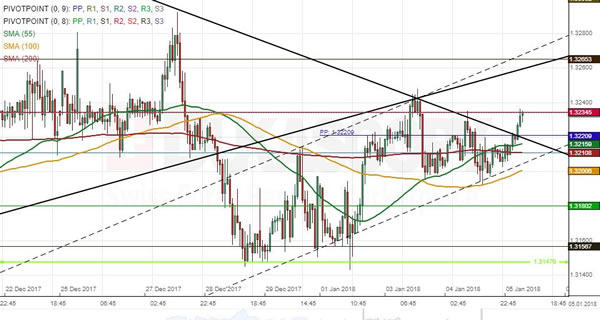
GBP/CHF has been trading in a channel down for the last five weeks. The pair was trading along its upper boundary for two sessions prior to breaching this line early today. It could demonstrate a possible breakout; however, this scenario should still be confirmed with more bullish candles, especially given that a breakout of an ascending wedge that occurred on December 28 points to a soon depreciation. Taking this into account, it is expected that the Sterling could still edge slightly higher during the following sessions (possibly up to the 1.3275 area where the monthly PP and the weekly R1 are located), but bears might soon take the upper hand in the market. This should be confirmed by a breakout of the 55-, 200– and 100-hour SMAs circa 1.3210.


