
.
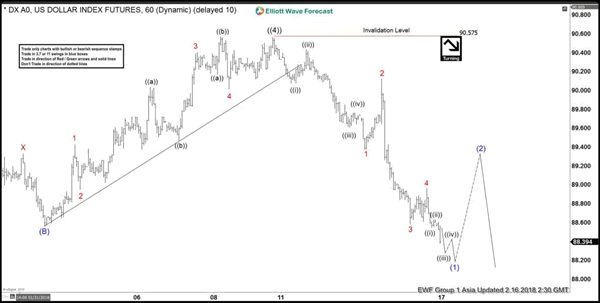
$DXY US dollar Index Short-term Elliott Wave view suggests that the rally to February 09.2018 peak at 90.57 ended Primary wave ((4)) in a Flat correction. Down from 90.57 high the decline is unfolding as Elliott Wave Impulse Sequence, where each leg has an internal distribution of 5-3-5 structure thus favored being an Impulse sequence. The DXY has managed to see a break below January 25 low (88.43) thus confirming more downside extension in Primary wave ((5)) lower.
From 2/09 high (90.57) cycle the DXY is close to ending that cycle in Intermediate wave (1) lower in 5 waves impulse, where internals for wave (1) lower ended Minor wave 1 at 89.38 and Minor wave 2 ended at 90.12 high. Minor wave 3 ended at 88.58 low, Minor wave 4 bounce ended at 88.96 high and below from there Minor wave 5 of (1) remains in progress. Which is expected to end in between 88.21-87.95 area lower but in case of further extension in Minor wave 5 could see as low as 87.78-87.50 5=1 target area. Afterwards, the index should do a bounce in Intermediate wave (2) for the correction of 2/09 peak (90.57) in 3, 7 or 11 swings before further downside extension is seen. We don’t like buying the index into a proposed bounce and as far as a pivot from 2/09 high (90.57) remains intact index should find sellers in 3, 7 or 11 swings for further downside.
DXY 1 Hour Elliott Wave Chart


)%20in%20a%20Flat%20correction.%20Down%20from%2090.57%20high%20the%20decline%20is%20unfolding%20as%20Elliott%20Wave%20Impulse%20Sequence,%20where%20each%20leg%20has%20an%20internal%20distribution%20of%205-3-5%20structure%20thus%20favored%20being%20an%20Impulse%20sequence.%20The%20DXY%20has%20managed%20to%20see%20a%20break%20below%20January%2025%20low%20(88.43)%20thus%20confirming%20more%20downside%20extension%20in%20Primary%20wave%20((5))%20lower.)