
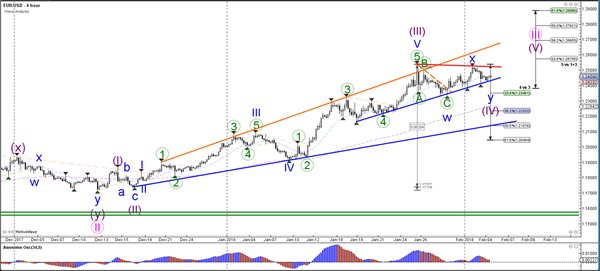
Currency pair EUR/USD
The EUR/USD failed to break above the previous top (red), which means that price could now be building a larger WXY (blue) correction. A break below the support trend line (blue) could indicate a deeper correction at the Fibonacci levels of wave 4 (purple), unless price breaks below the 50%. A break above the resistance (red) could indicate an uptrend continuation within wave 5 (purple).

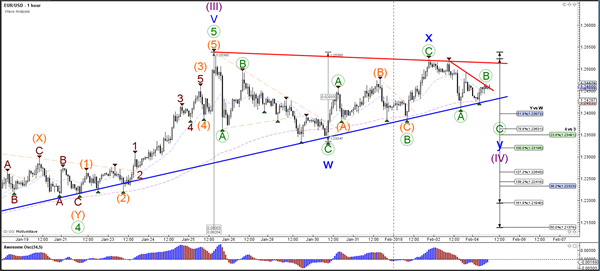
The EUR/USD is probably building a bearish ABC (green) correction within wave 4 (purple) unless price manages to break above the resistance (red) trend lines. A bullish break could start a continuation of the uptrend.
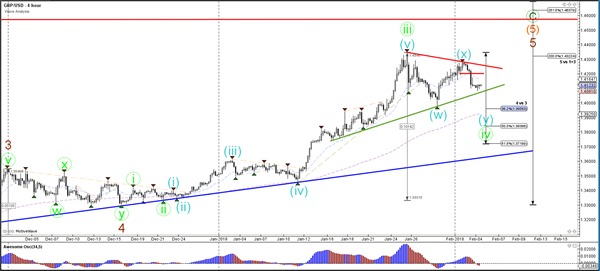
Currency pair GBP/USD
The GBP/USD is building a triangle pattern which is marked by support (green) and resistance (red). A bullish breakout could indicate an uptrend continuation.
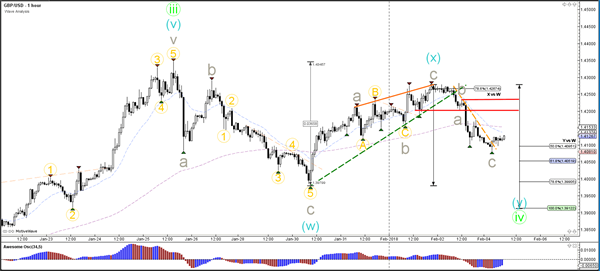
The GBP/USD completed a bullish ABC (grey) rather than a 123 when price broke below the support trend line (dotted green). Whether the bearish ABC (grey) has been completed remains to be seen and depends if price is able to break above resistance (red).
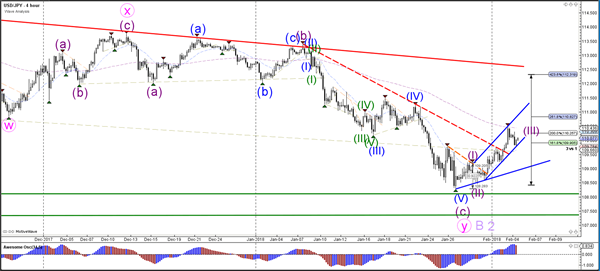
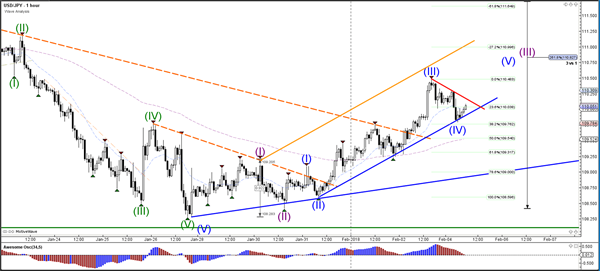
Currency pair USD/JPY
The USD/JPY broke above thelarger resistance trend line (red) and is most likely building a bullish wave 3 (purple).
The USD/JPYis in a bullish channel. The current bearish retracement is testing the Fibonacci support levels of wave 4 (blue) which could be bouncing spots for a continuation higher towards the Fib targets.


 Pullback to Find Support")


,%20which%20means%20that%20price%20could%20now%20be%20building%20a%20larger%20WXY%20(blue)%20correction.%20A%20break%20below%20the%20support%20trend%20line%20(blue)%20could%20indicate%20a%20deeper%20correction%20at%20the%20Fibonacci%20levels%20of%20wave%204%20(purple),%20unless%20price%20breaks%20below%20the%2050%.%20A%20break%20above%20the%20resistance%20(red)%20could%20indicate%20an%20uptrend%20continuation%20within%20wave%205%20(purple).)