
Currency pair EUR/USD
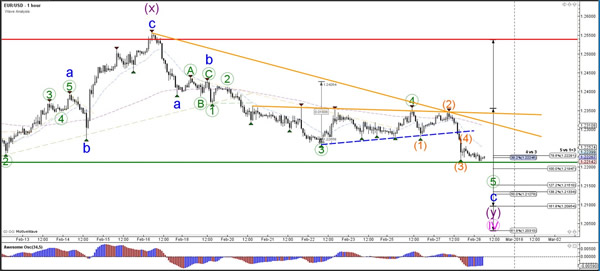
The EUR/USD broke below the support trend line (dotted blue) and is now testing the previous bottom (green). The support zone is a key decision level for a bullish bounce or bearish breakout and will decide whether USD strength or weakness will prevail.A bearish break makes a wave 4 (purple) pattern less likely.
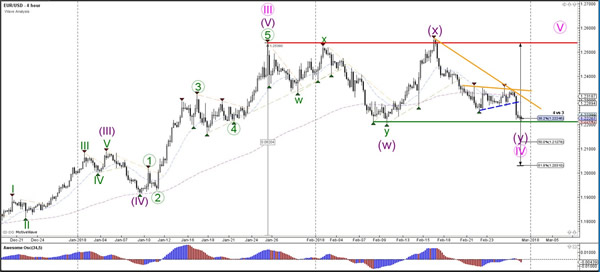

The EUR/USD needs to break above the resistance trend lines (orange) beforea bullish breakout is likely. A bearish breakout would need to show strong bearish price action before continuation lower is possible.

Currency pair GBP/USD
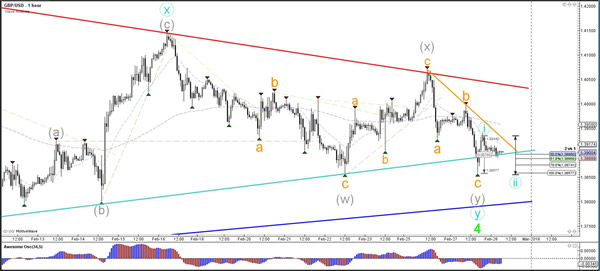
The GBP/USD is in a triangle chart pattern with multiple support and resistance trend lines near it. Price will need to break the S&R to start a new trend.
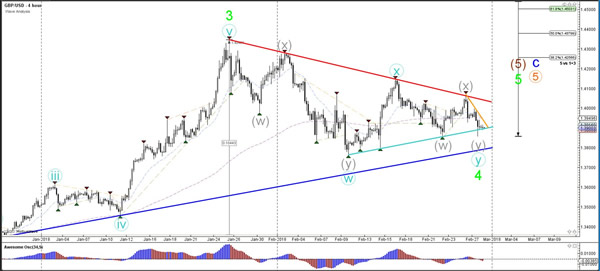
The GBP/USD indeed completed a bearish ABC (orange) zigzag yesterday, which is probably part of a larger WXY correction (grey).Price could show bullish reversal if price manages to break above resistance (orange). A break below the 100% Fib shows bearishness.
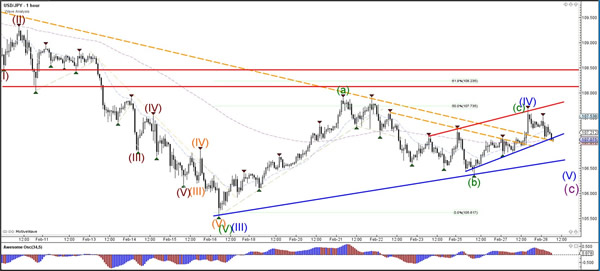
Currency pair USD/JPY
The USD/JPY is probably in a wave 4 (blue) as long as price stays below resistance (red).
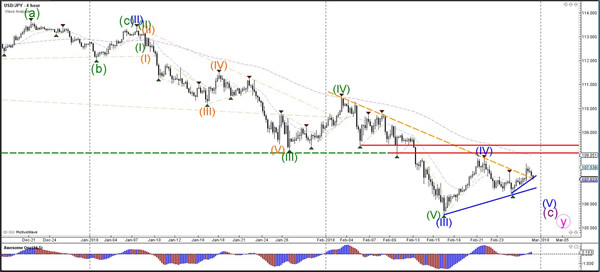
The USD/JPY could be building an ABC (green) correction within wave 4.


%20and%20is%20now%20testing%20the%20previous%20bottom%20(green).%20The%20support%20zone%20is%20a%20key%20decision%20level%20for%20a%20bullish%20bounce%20or%20bearish%20breakout%20and%20will%20decide%20whether%20USD%20strength%20or%20weakness%20will%20prevail.A%20bearish%20break%20makes%20a%20wave%204%20(purple)%20pattern%20less%20likely.)