
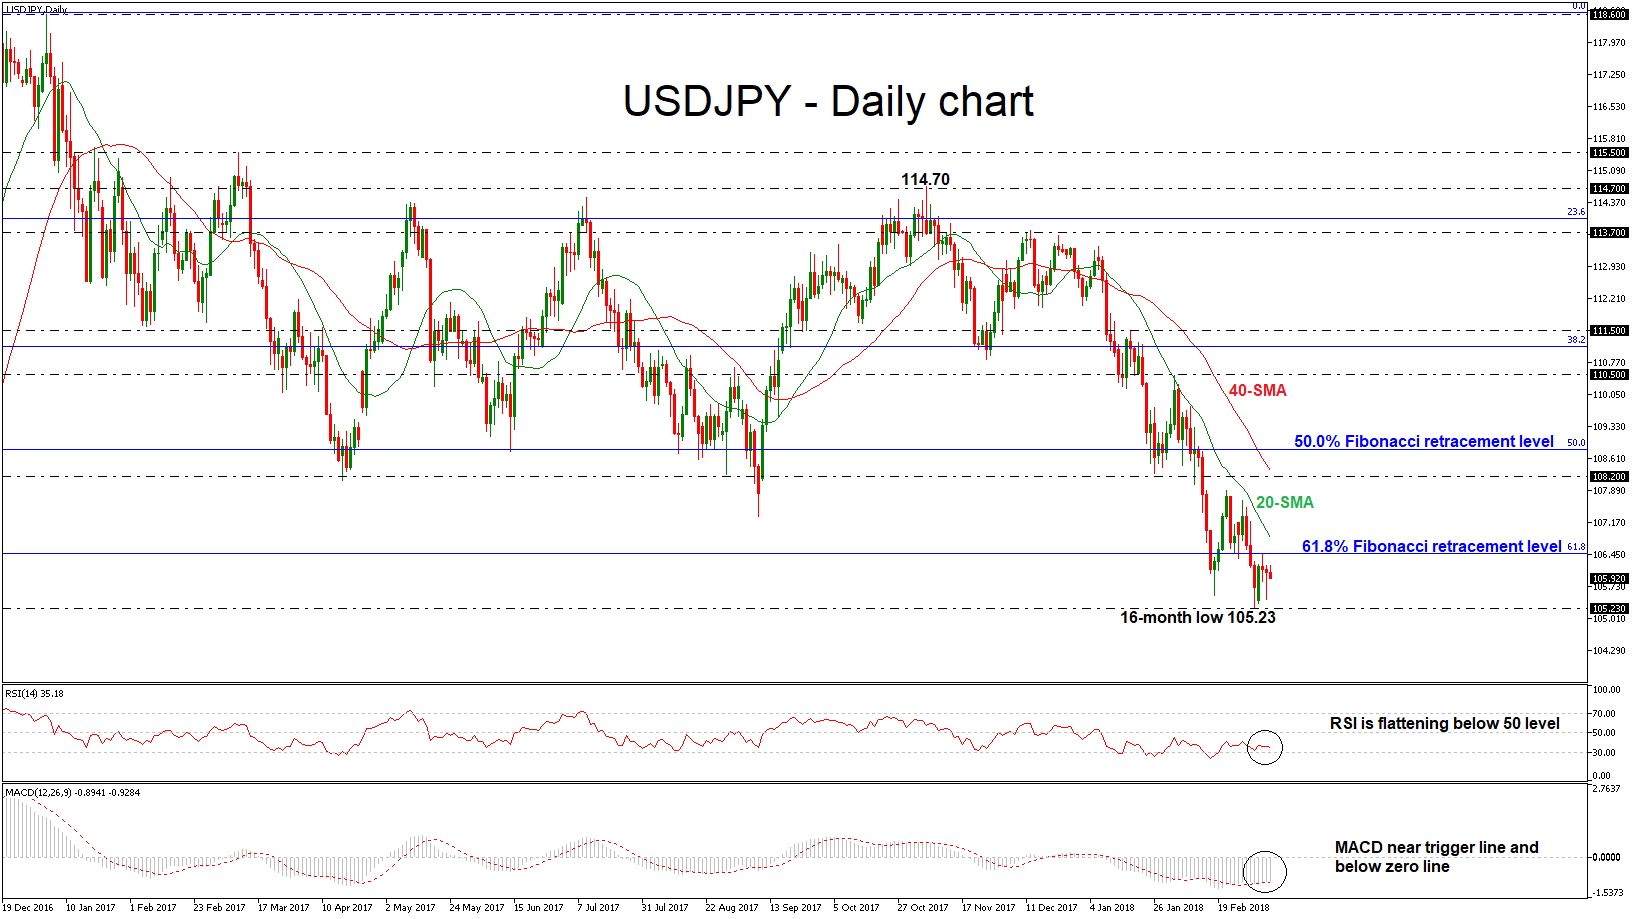
USDJPY is hovering around the 106.00 handle as it refused for the second day in a row to jump above the 61.8% Fibonacci retracement level at 106.47of the upleg from 99.00 to 118.60. When looking at the bigger picture the pair is creating a bearish trend as it slipped below the trading range within 108.20 – 114.70 in the previous weekly sessions.
In the daily timeframe, the price bounced off the 61.8% Fibonacci mark and the 20 and 40 simple moving averages are negatively aligned following the price action. The RSI indicator is flattening in the negative zone, while the MACD oscillator is holding near its trigger line. Technical indicators lack to show a clear signal.
If prices fall below the 16-month low of 105.23, there is scope to test the 101.00 strong psychological level taken from the low in November 2016. Before that, there are no any immediate support levels and the price could create a downside rally until the aforementioned obstacle.
On the flip side, a successful attempt above the 61.8% Fibonacci level, could shift the focus to the upside towards the 108.20 resistance level near the 40-SMA. However, the price needs to go through the 20-SMA. Further up, there is a resistance barrier at 50.0% Fibonacci mark near 108.80.


