
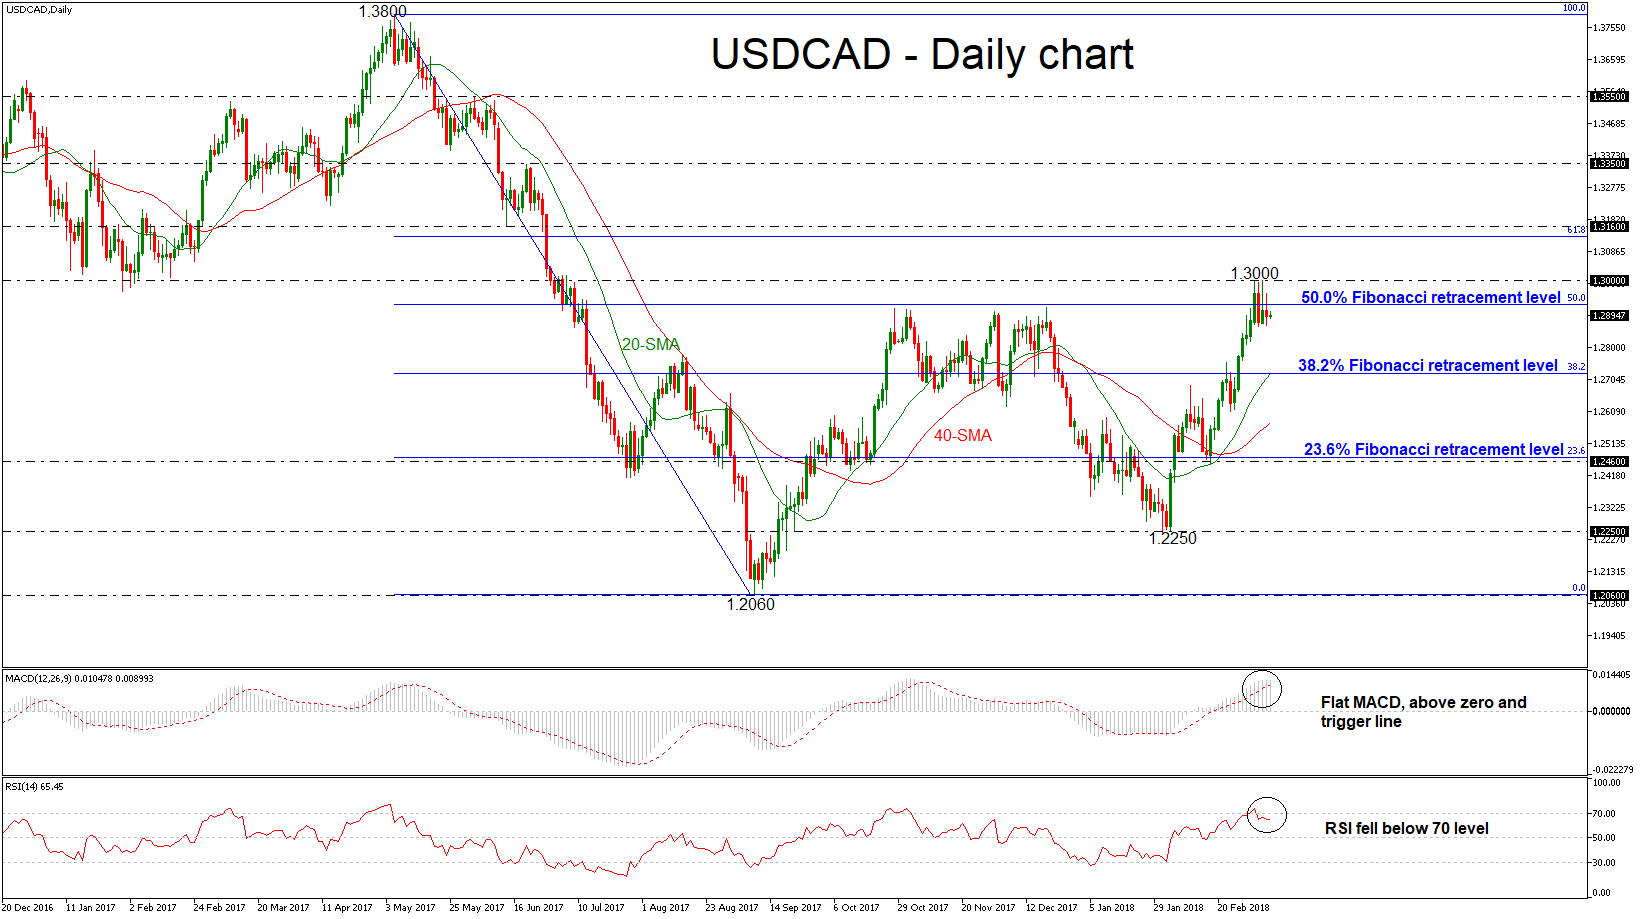
USDCAD is trading sideways after the aggressive buying interest that was created following the rebound on the 1.2250 support level. The pair hit an eight-month high near the 1.3000 critical psychological level and successfully surpassed the 50.0% Fibonacci retracement level at 1.2930 of the downleg from 1.3800 to 1.2060.
However, currently, the price action has slipped below the aforementioned obstacle and is holding near its opening level at 1.2890. The short-term technical indicators are endorsing the possible retracement on the price as the momentum is too weak to provide a sustained move higher.
In the daily timeframe, the MACD oscillator is holding in the positive territory but is moving sideways, while the RSI indicator dropped below the overbought area and is sloping to the downside. The indicators are suggesting that the latest upswing may be running out of steam and that the risk of a near-term correction is high. On the other hand, the 20 and 40 simple moving averages are continuing the upward movement.
If the price continues to extend its uptrend, this would mirror further improvements above the 1.3000 handle. The price could hit the 61.8% Fibonacci mark slightly below the 1.3160 resistance barrier. A jump above this area could open the door for the 1.3350 level.
On the flip side, if figures disappoint could create a bearish correction and hit the 38.2% Fibonacci mark, which overlaps with the 20-SMA near 1.2720. Moreover, a deeper move could shift the focus to the downside until the 1.2460 support barrier.


