
Current Elliott Wave view in EURUSD suggests that the pair remains in sideways triangle Elliott Wave structurebetween 1.2153 low and 1.255 high. Triangle is a consolidation structure with ABCDE label. It has no particular trend and is usually a continuation structure. Since the previous trend in EURUSD up to 1.255 high on 2.16.2018 is bullish, this means that pair may resume the upside after the triangle is complete.
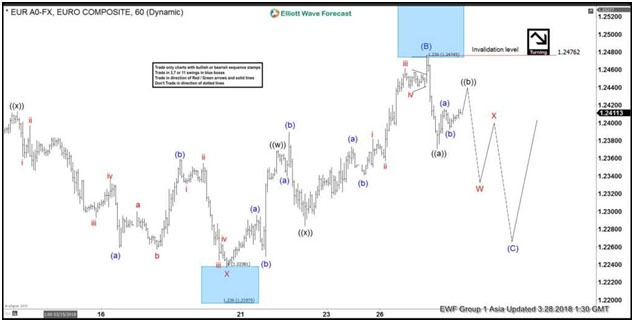
From the high of 1.255 on 2.16.2018, pair is trading sideways where Intermediate wave (A) ended at 1.2153 and Intermediate wave (B) ended at 1.2476. Subdivision of Intermediate wave (B) unfolded as a double three Elliott Wave structure where Minor wave W ended at 1.2446, Minor wave X ended at 1.2237, and Minor wave Y of (B) ended at 1.2476. Intermediate wave (C) is currently in progress in 3, 7, or 11 swing to correct cycle from 3.1.2018 low before pair turns higher in Intermediate wave (D). Near term, decline from 1.2476 high ended at 1.2371 with Minute wave ((a)). While Minute wave ((b)) bounce fails below 1.2476, expect pair to extend lower to continue the correction in Intermediate wave (C). We don’t like selling the pair.
EURUSD 1 Hour Elliott Wave Chart


