
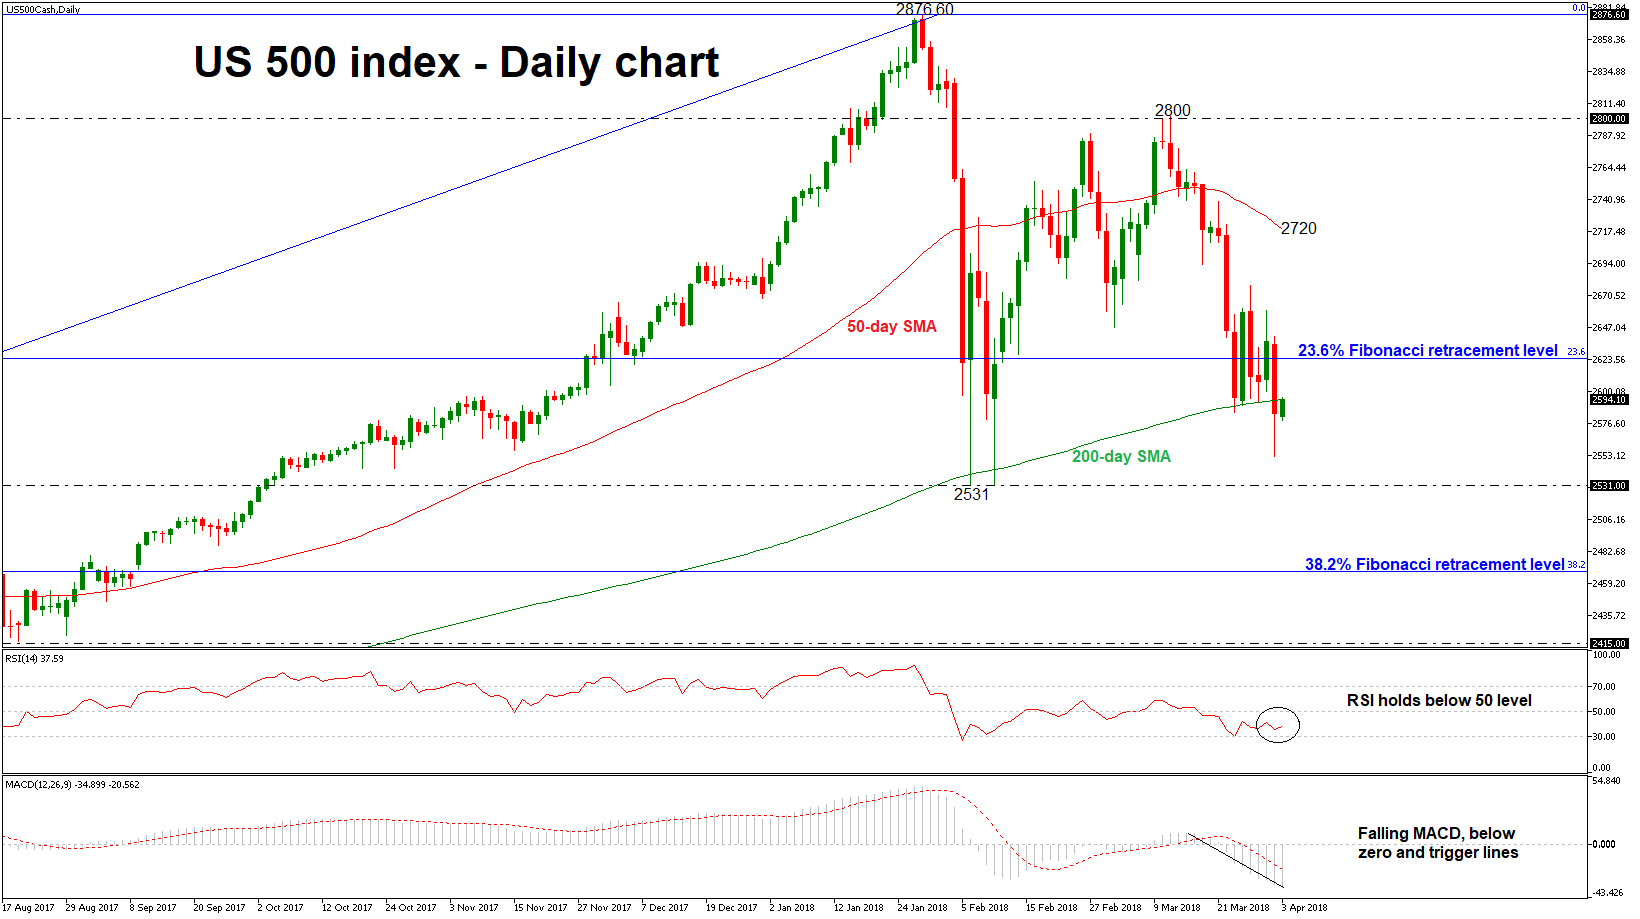
The US 500 index had a rough bearish ride over Monday’s trading session, as the index extended its losses and ended the day below the significant 200-day simple moving average (SMA). The bullish picture in the medium-term seems to weaken as there are some signs of a bearish correction. The technical structure supports that the downward retracement is likely to continue in the short-term.
Looking at momentum indicators, in the daily timeframe, the RSI indicator is lacking direction below the 50 level, while the MACD oscillator is falling aggressively under the zero and trigger lines. As a side note, the two SMAs (50 and 200) are pointing to the downside, confirming further declines.
If the price remains below the 200-SMA near 2594, which is acting as significant resistance level at the moment, this could push the index towards the next support at 2531, taken from the bottom on February 6. A stronger barrier though could be found at the 38.2% Fibonacci retracement level of 2468 of the upleg from 1807 to 2876.60.
On the flipside, a move to the upside could see immediate resistance at the 23.6% Fibonacci mark near 2624 but should the market increase positive momentum above this area, the 50-day SMA around 2720 could be the next level in focus. A successful jump above this zone could see a re-challenge of the previous 2-month high of 2800.


