
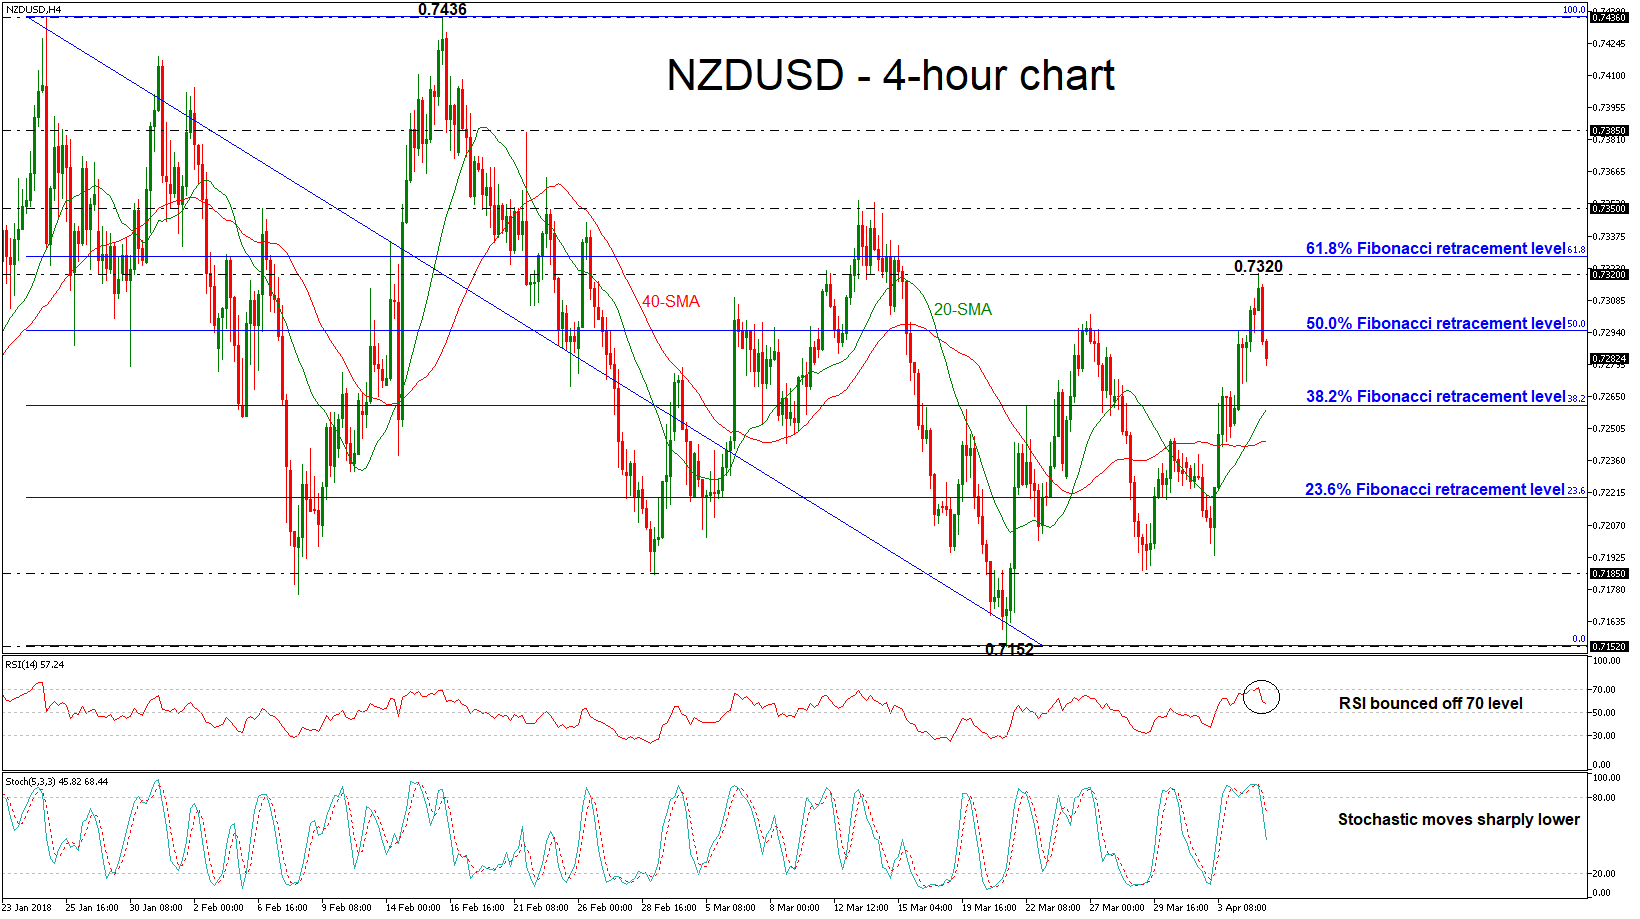
NZDUSD has reversed back down again after finding resistance at the 3-week high of 0.7320 achieved during today’s Asian session. This top is just below the 61.8% Fibonacci retracement level of the downleg from the high of 0.7436 to the low of 0.7152.
Momentum indicators in the 4-hour chart, are pointing to a bearish bias with the RSI indicator bouncing off the overbought zone and approaching the 50 level in an aggressive manner. Moreover, the stochastics have overstretched and posted a bearish cross above the 80 level and turned into negative.
Further losses should see the 38.2% Fibonacci of 0.7260 acting as a major support as this is also where the 20-simple moving average (SMA) is currently standing. A drop below the 20-SMA would reinforce the bearish structure in the short-term and open the way towards the next key level of 40-SMA around 0.7245 at the time of writing.
In the event of an upside reversal, the 61.8% Fibonacci near 0.7330 could act as a barrier before being able to re-challenge the 0.7350 resistance zone. A break above this level would shift the short-term outlook to a more bullish one as it would take the pair towards the 0.7385 barrier.
To sum up, a bearish movement is predicted in the short-term as the technical indicators and the current market price action confirm the negative scenario.


