
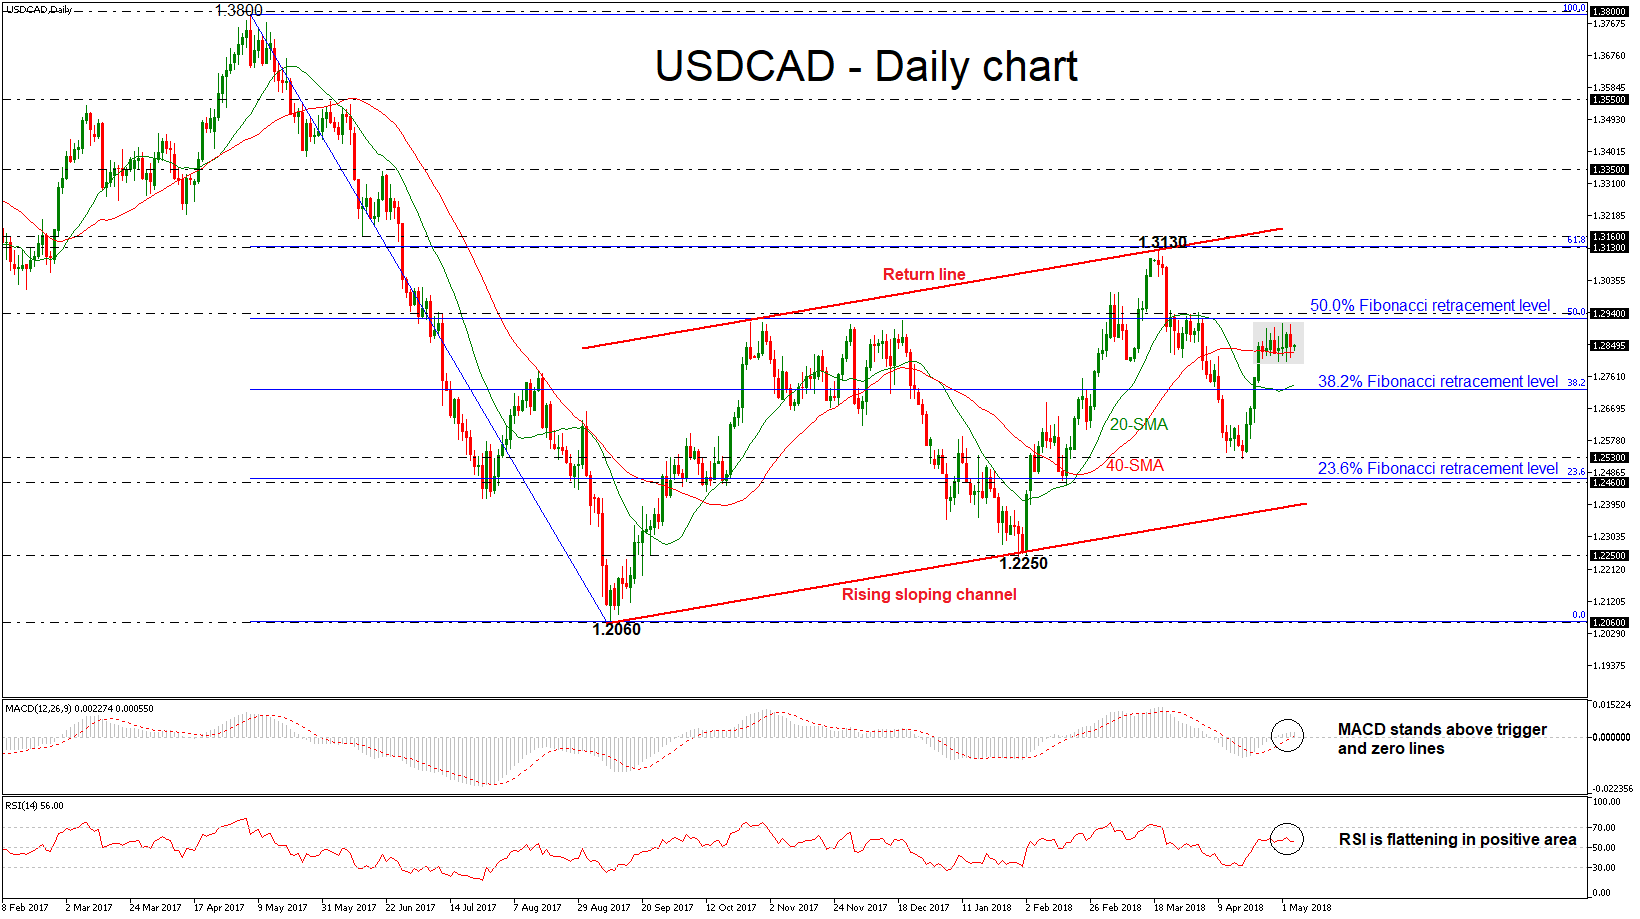
USDCAD remains below the 50.0% Fibonacci retracement level of 1.2925 of the downleg from 1.3800 to 1.2060 over the last 10 days and creates a narrow range with upper boundary the 1.2925 and lower boundary the 1.2800 handle. The price is also developing above the 40-day simple moving average (SMA) and has so far not slipped below it. When looking at the bigger picture, the pair has been trading within a rising sloping channel since September 2017, failing several times to exit from this range.
The technical indicators though, continue to send neutral signals, but they are still standing in positive zones. The MACD oscillator is standing slightly above the zero and trigger lines, while the RSI indicator is flattening, suggesting weak movement.
Should the pair manage to strengthen its positive momentum, the next resistance could come around the 50.0% Fibonacci level slightly below the 1.2940 strong resistance level. A break above this level would endorse the bullish bias and open the way towards the 1.3130 – 1.3160 resistance zone, which stands near the return line of the upward sloping channel.
In case of declines in the pair, immediate support may be found near the 38.2% Fibonacci of 1.2720, which holds near the 20-day SMA. A downside break of this zone would open the way towards the 1.2530 support barrier. If sellers manage to push below that hurdle too, that could drive the price until the 23.6% Fibonacci near 1.2460.


