
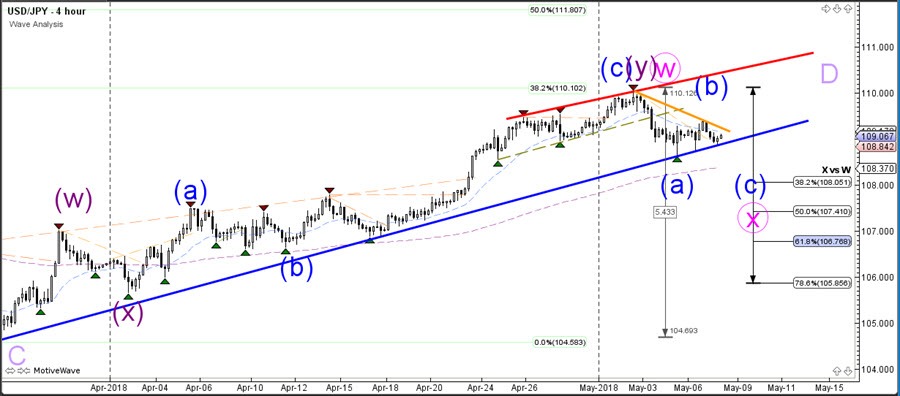
The USD/JPY is at key zone that could determine whether price will build a larger bearish correction or continue the bullish trend. Price would need to break above the previous top at 110 to confirm the uptrend whereas a break below the support trend lines (blue) near 109 indicate that a larger bearish correction within wave X (pink) becomes more likelytowards 108 and 107.50 support levels. A bullish breakout above the 110 resistance level could indicate an extension of the wave W (pink) towards the 50% Fib at 111.50.
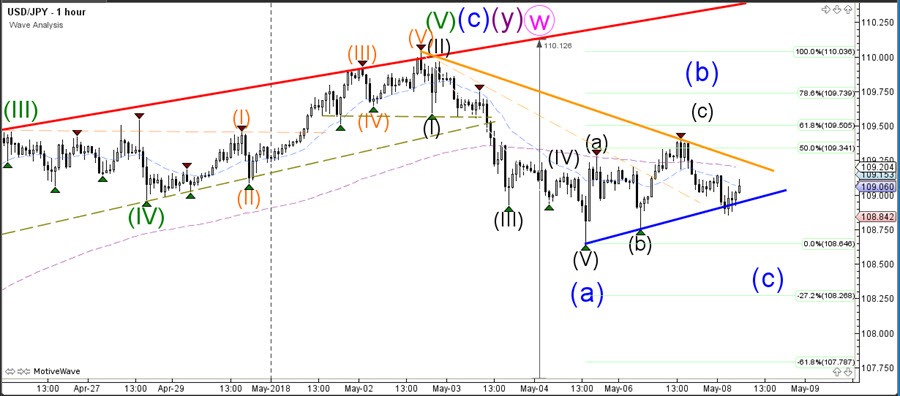
The USD/JPY could perhaps be building a larger ABC (blue) zigzag correction but a break above the 100% Fibonacci level and resistance zone at 110 invalidates this wave pattern. A break below the support trend line (blue) is needed before such an ABC becomes more likely, otherwise the currency pair is in a difficult spot at the moment.


