
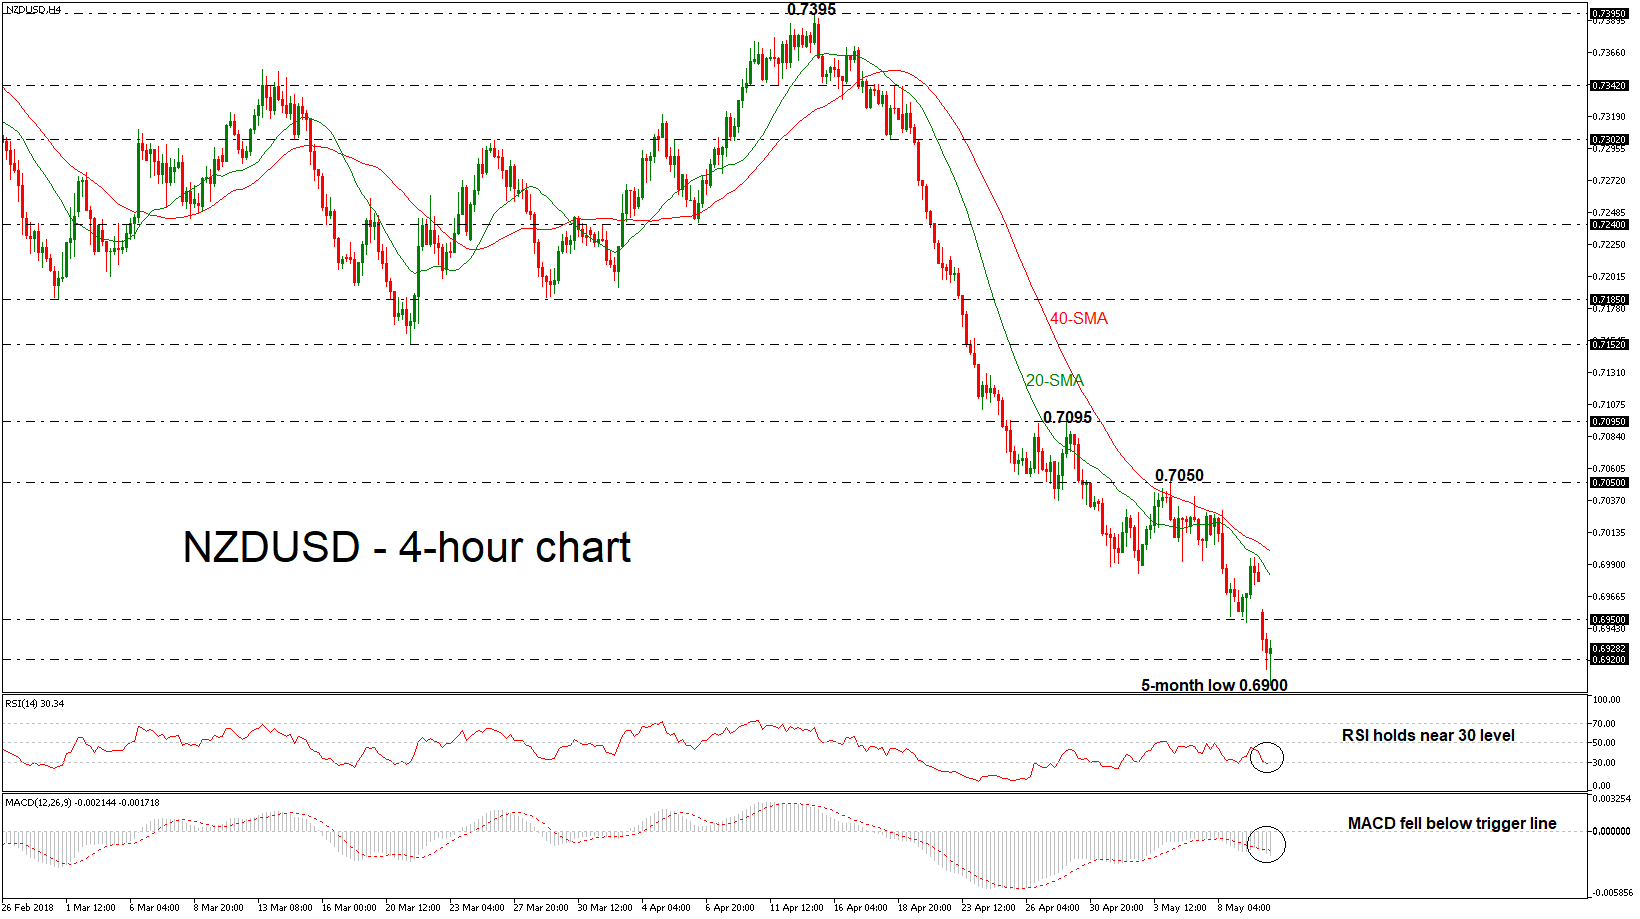
NZDUSD starts the day with a gap down and an aggressive bearish rally recording a fresh five-month low around the 0.6900 psychological level. The negative momentum remains in play as technical indicators endorse the scenario for further declines.
Technically, in the 4-hour chart, the RSI indicator slipped near the 30 level and is trying to enter the oversold zone, while the MACD oscillator is strengthening its negative bias as it is holding below its trigger and zero lines. In addition, the 20- and 40-simple moving averages (SMAs) are following the price action and refused to create a bullish cross in the previous days.
In case of further declines in the pair, immediate support may be found near the 0.6820 support level, identified by the December 8, 2017 low. If sellers manage to push below that hurdle too, that would mark a lower low in the 4-hour chart, increasing the probability for further bearish extensions. Support may be found initially near 0.6780, taken from the low on November 11, 2017.
However, if the market manages to pick up speed and climb above 0.6950, the 20 and 40 SMAs could as strong resistance levels for the bulls at 0.6980 and 0.7000 respectively. Clearing these key levels would see additional gains towards the 0.7050 resistance barrier.


