
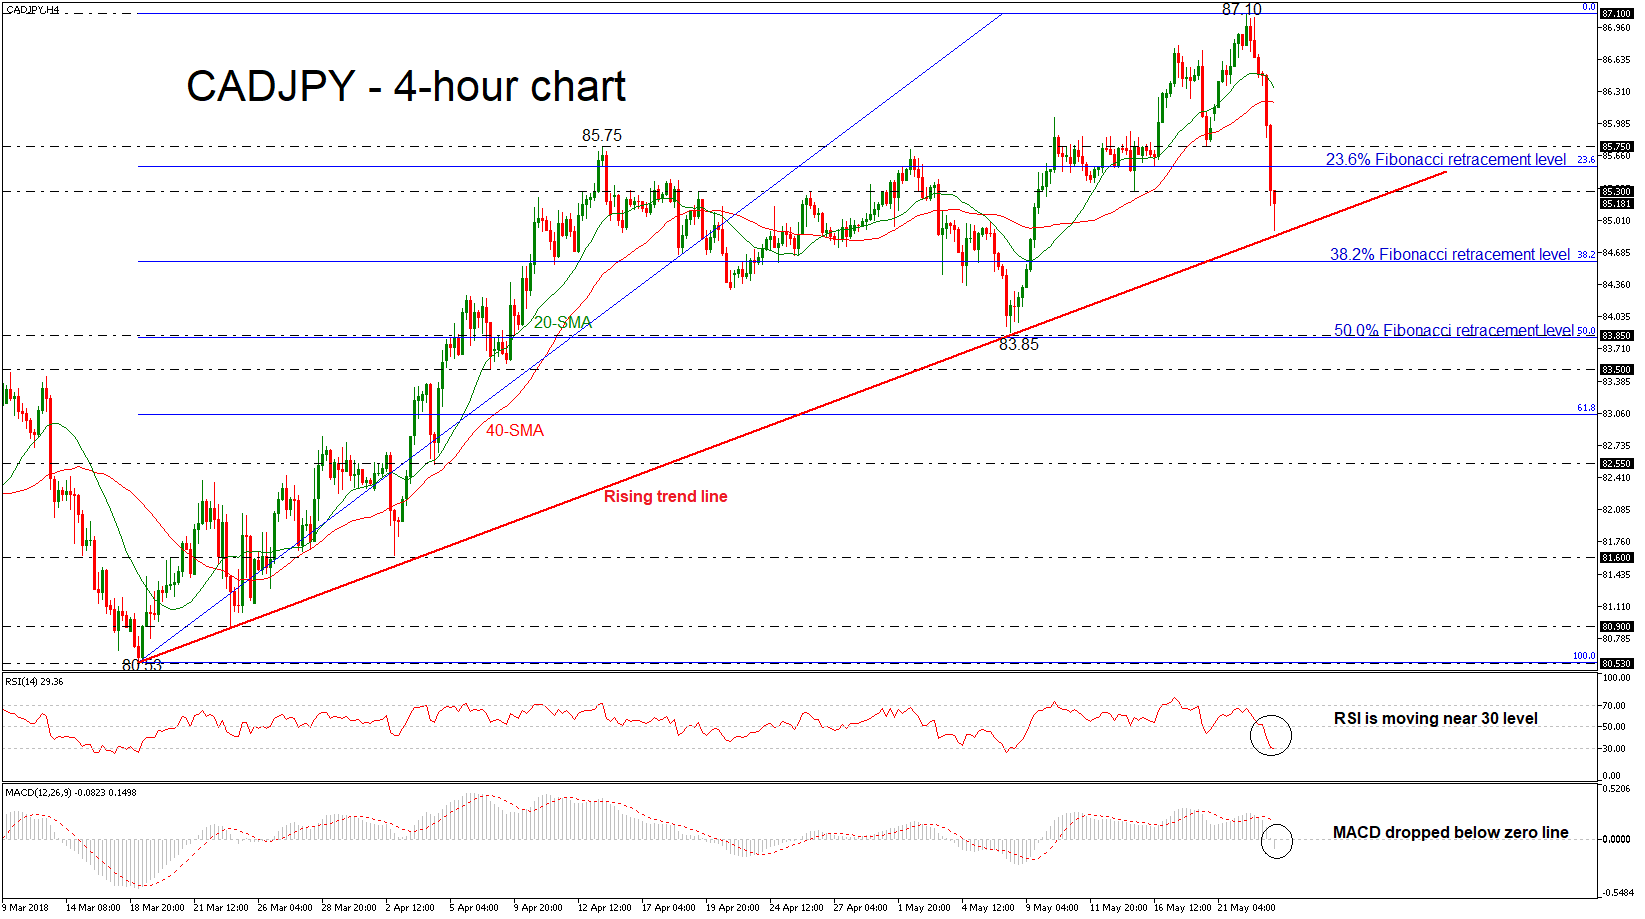
CADJPY is having an aggressive bearish run during Wednesday’s trading session and is set to complete the seventh red candle in a row in the 4-hour chart. The price has extended its losses below the significant 23.6% Fibonacci retracement level of the upleg from 80.53 to 87.10, around 85.55, while it slipped below the 85.30 barrier as well, creating a new two-week low of 84.91.
Short-term momentum indicators are also pointing to a continuation of the bearish bias. However, the RSI indicator is holding slightly below the 30 level but lost some of its strong negative movement. The MACD oscillator dropped in the negative territory after several positive sessions.
Should prices reverse lower, immediate support could come at 84.60, which is the 38.2% Fibonacci mark. Further losses would open the way towards the 50.0% Fibonacci, which is another major support around the 83.85 support hurdle.
To the upside, there is immediate resistance just above the current market price at 85.30, while above that, the next major resistance to watch is the 23.6% Fibonacci mark of 85.55. Slightly above this zone, resistance is coming from the 85.75 barrier. In case of a higher move, the 40-simple moving average (SMA) in the near-term could act as significant obstacle near 86.20 at the time of writing.
In the bigger picture, the longer-term uptrend, which has been holding since March 19, is at risk as the pair is trying to touch the ascending trend line.


