
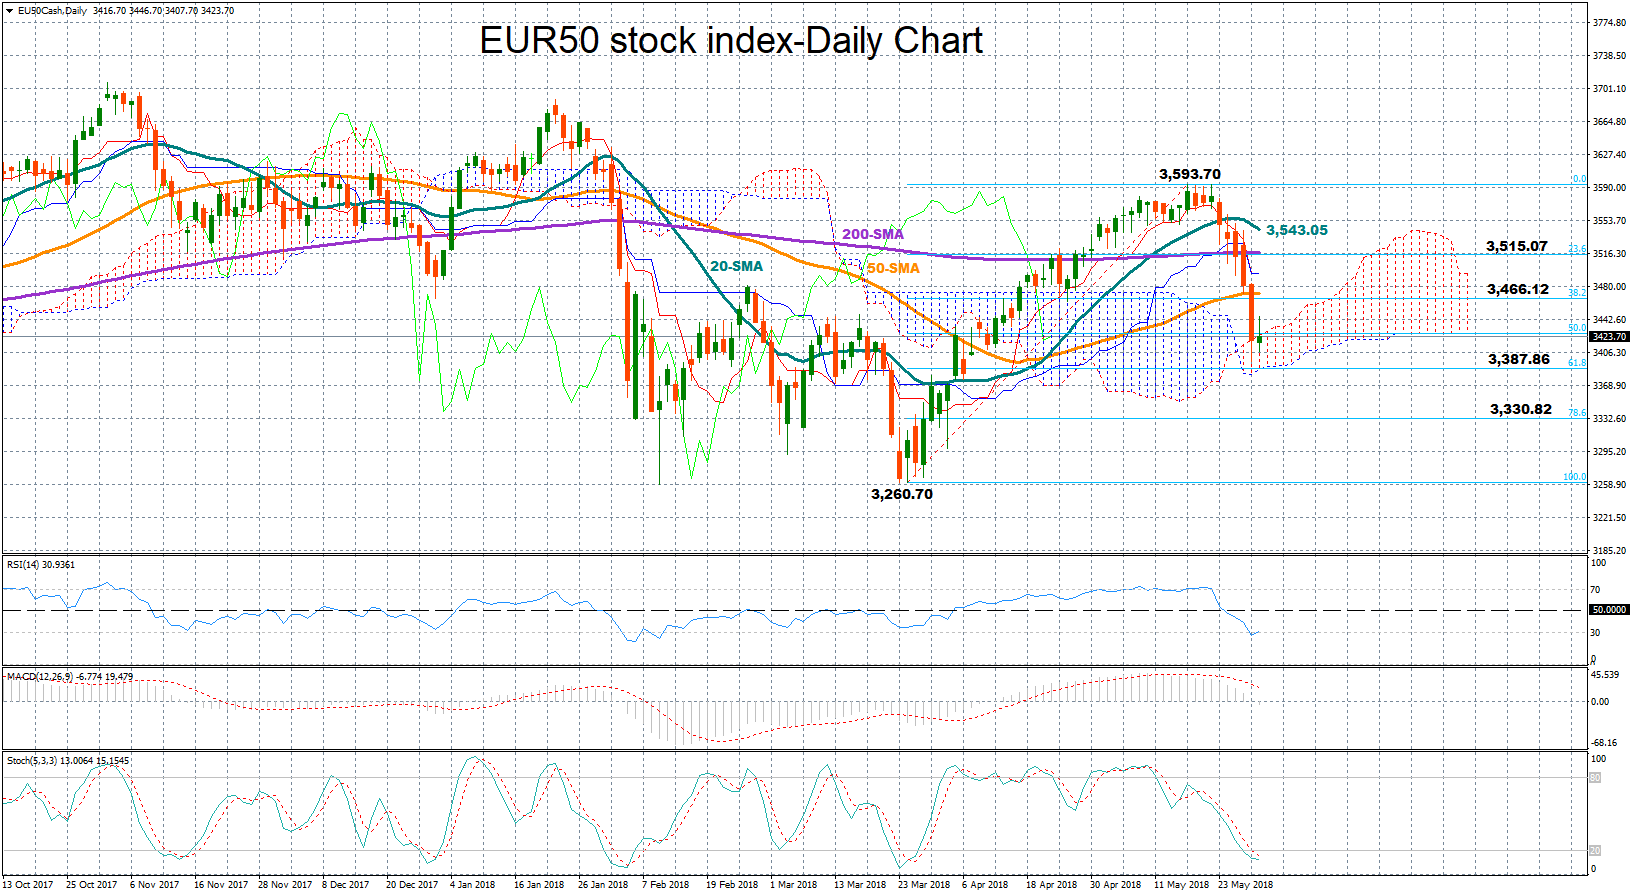
The blue-chip Euro 50 stock index has been on the back foot over the past six days after spending a few days testing the 3 ½-month high of 3,593.70, reached first on May 17. At the moment there is not much evidence supporting that the downtrend could be nearing an end since the price is below its moving averages (SMA) which show no sign of reversing to the upside; the 20-day SMA is currently pointing to the downside, suggesting the sell-off could remain in place.
The MACD has deviated further below its red signal line and has just crossed below zero, hinting that negative momentum is likely to persist in the short-term. Yet upside corrections cannot be ruled out yet given that both Stochastics and the RSI are in the oversold zone. The former is ready to post a bullish cross below 20, while the latter is around 30 and set to rebound.
In case of a decline, the price could find support at the 61.8% Fibonacci of 3,387.86 of the upleg from 3,260.70 to 3,593.70, where the bottom of the Ichimoku cloud happens to be. A close below that level could reinforce the bearish case, sending the market lower to the 78.6% Fibonacci of 3,330.82 which has acted as support from February to March. Then, if price breaks even lower, the way could open towards the more-than-a-year low 3,260.70.
Alternatively, a rebound could face resistance at the 38.2% Fibonacci of 3,466.12, meeting the 50-day SMA in the same area, while a leg above from here could increase buying interest, opening the way towards the 23.6% Fibonacci and the 200-day SMA at 3,515.07. A break however above the 20-day SMA at 3,543.05 could increase confidence that the upleg from 3,260.70 could resume soon, turning the medium-term picture from neutral to bullish again.


