
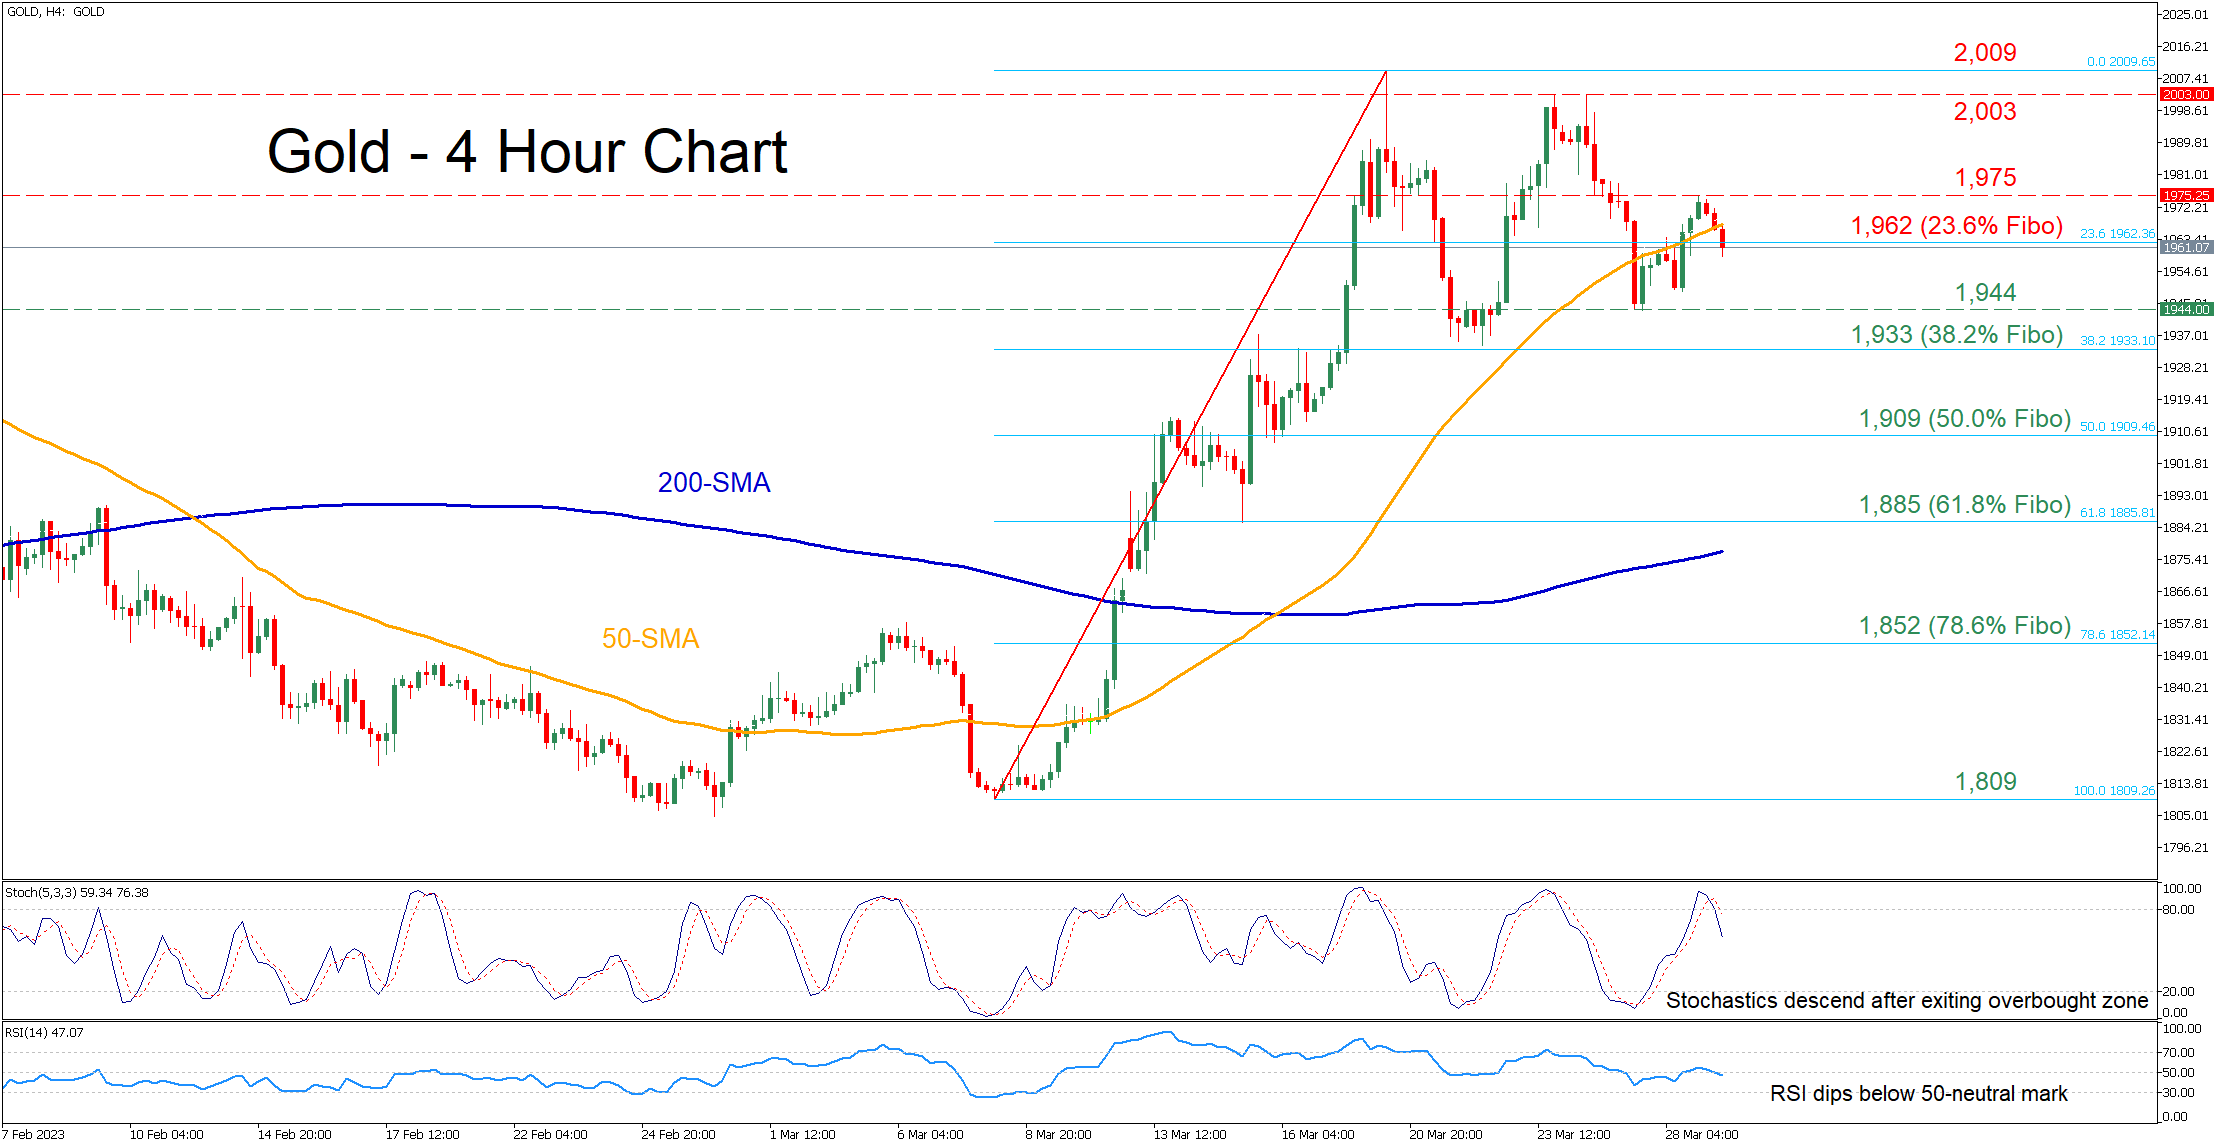
Gold had been edging higher in the four-hour chart, peaking at a fresh one-year high of 2,009 on March 20 before entering a sideways move. In the near term, bullion dropped below its 50-period simple moving average (SMA) after its latest rebound got rejected.
The momentum indicators currently suggest that bearish forces are in control. Specifically, the stochastic oscillator is descending after posting a bearish cross in the overbought zone, while the RSI has crossed below its 50-neutral mark.
Gold has been fluctuating above and below the 1,962 mark in today’s session, which is the 23.6% Fibonacci retracement of the 1,809-2,009 upleg. If the price clearly slides beneath that zone, the recent support of 1,944 could act as the first line of defense. Should that floor collapse, the commodity could then test the 38.2% Fibo of 1,933. Further declines could cease at the 50.0% Fibo of 1,909.
Alternatively, should buyers regain the upper hand, the price might encounter resistance at the recent rejection region of 1,975. Conquering this barricade, the bulls may aim for the 2,003 hurdle, which held strong twice in March. A break above that zone could pave the way for the one-year high of 2,009.
Overall, gold seems to be entering another round of weakness after its latest rebound came to a halt. Therefore, a fresh lower low is needed to signal the extension of the price’s recent downside correction.


")


%20after%20its%20latest%20rebound%20got%20rejected.)