
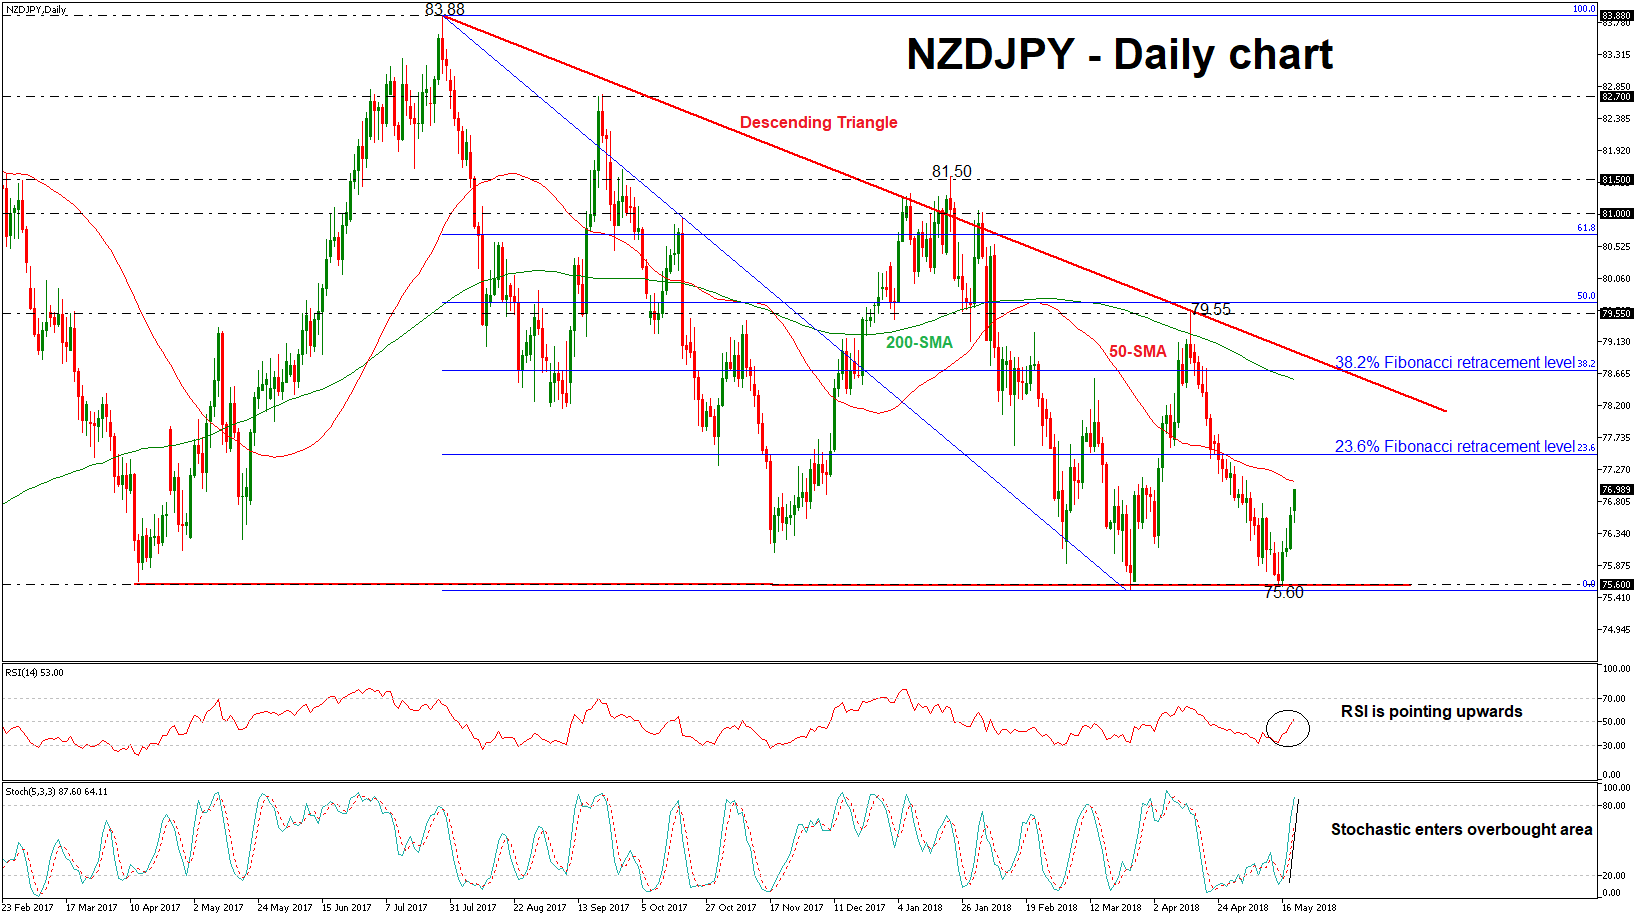
NZDJPY has reversed back up again after finding support at the 11-month low of 75.60, achieved on March 23. This low is the lower boundary of the descending triangle in the long-term timeframe and currently, the pair is set to record the fourth consecutive green day.
Momentum indicators are pointing north to a positive bias in the short-term with the RSI indicator just above the 50 threshold. The stochastic oscillator is moving strongly upwards as the %K line entered the overbought zone and the %D line is following this momentum, underscoring the current upside reversal.
Further gains should see the 23.6% Fibonacci retracement level of 77.50 of the downleg from 83.88 to 75.51 come into scope. The next level to have in mind is the 38.2% Fibonacci region of 78.70, which stands near the 200-day SMA. A climb above this level would reinforce the bullish structure in the near-term.
In the event of the continuation of the downside trend, the 75.60 trough could act a barrier before being able to break the triangle formation. A drop below this area would endorse the bearish outlook and would take the pair towards the 73.70 support barrier, identified by the low of November 2016.
In the long-term timeframe, NZDJPY has been developing within a descending triangle since April 2017, with a weak penetration to the upside in January 2018.


